

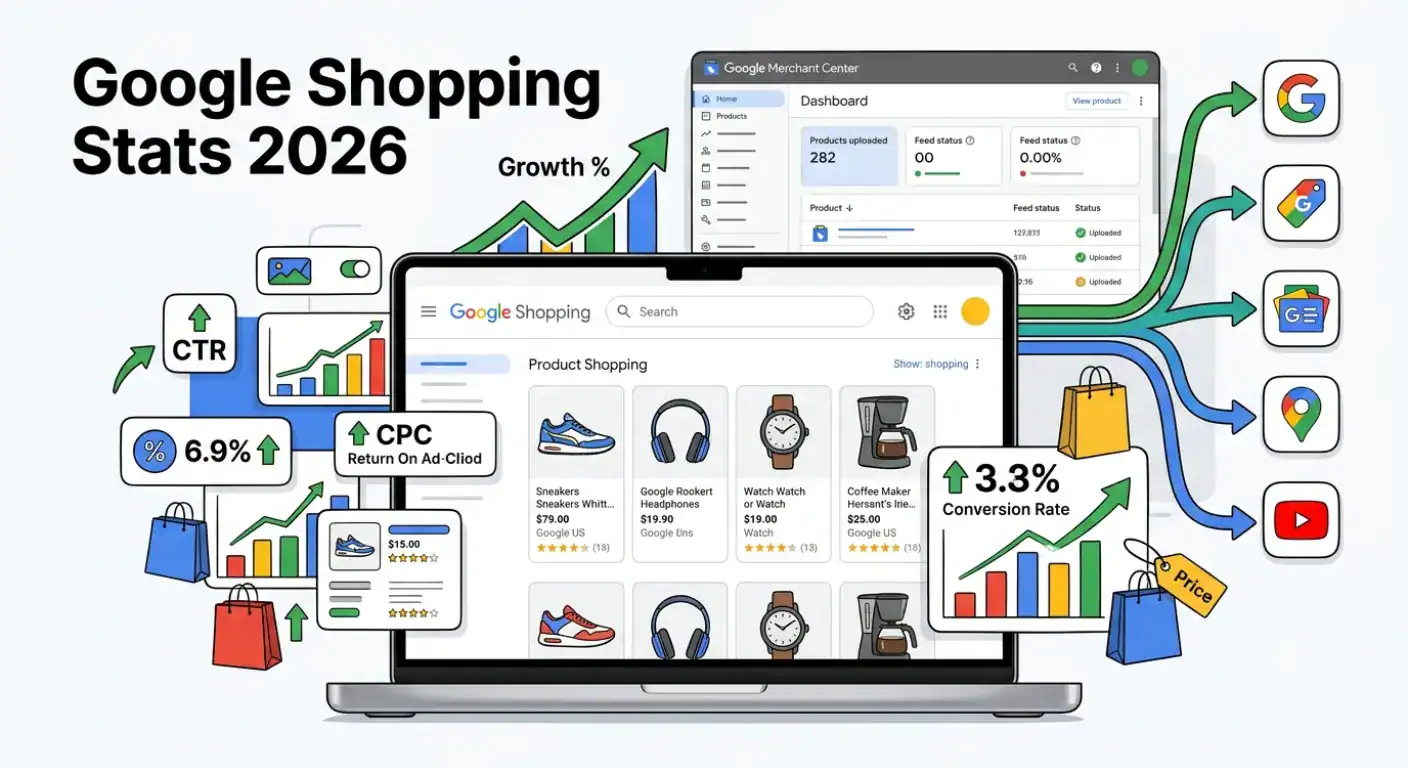
Statistics in this article are sourced from official Alphabet SEC filings, WordStream 2025-2026 Google Ads benchmarks, DemandSage Google Ads statistics, Triple Whale 2025 benchmarks report, OwlClaw Google Shopping benchmarks 2026, and additional verified industry sources. Data reflects the most recent available figures as of mid-2026.
| TL;DR Google Ads generated USD 294.68 billion in advertising revenue in 2025, a 10%+ increase year-on-year, with Q4 2025 alone generating USD 82.3 billion. Google Shopping Ads account for 76% of all retail search ad spend and 85% of all clicks on Google retail campaigns – making them the dominant format for ecommerce advertisers. Average Google Shopping CTR: 0.86%. Average Shopping CPC: USD 0.66 globally (EUR 0.36 in European Shopping campaigns). Average conversion rate: 1.91%.Performance Max now accounts for 34% of total Google Ads spend in 2026, with 93% of retail advertisers running PMax for Shopping campaigns. Google Merchant Center is free to use. Products approved in GMC can appear across Google Search, Shopping tab, Images, Maps, and YouTube. Feed quality is the primary ranking signal. |
Google Shopping is the largest paid channel for ecommerce advertising globally. For every euro or dollar spent on retail search advertising in 2025, approximately 76 cents went to Shopping formats – not text ads. Yet the gap between merchants who treat Google Shopping as a simple feed upload and those who actively optimise it is wider than in almost any other advertising channel.
This article compiles the most current available statistics on Google Shopping – its scale, cost trends, performance benchmarks, and the Google Merchant Center platform that underpins all of it – so you can understand where your campaigns stand relative to the market and what levers drive results.
Google Shopping users and reach (2026)
Google processes more than 8.5 billion searches per day globally, with 79%+ of desktop search traffic and approximately 83.5% worldwide search market share. Its Display Network reaches 90%+ of internet users. 36% of product searches in 2025 began on Google, making it the starting point for more product discovery than any other single platform.
| Google reach – key statistics 8.5 billion+ daily searches on Google globally – DemandSage Google Ads statistics 2026 83.5% – Google’s worldwide search market share in 2026 – WebFX Google Ads statistics 2026 79% – Google’s share of daily desktop search traffic (2025 Statista data) – Shopify Google Merchant Center guide 90%+ of internet users reached by the Google Display Network across 2 million+ websites, apps, and videos – WebFX / uproas.io Google Ads statistics 4.77 billion internet users reachable via Google Ads globally – Rudys.ai Google Ads benchmarks 2026 7 million+ active businesses and agencies running Google Ads campaigns – Rudys.ai / DemandSage 2026 1.2 billion – monthly searches on Google Shopping specifically – ElectroIQ Google Shopping statistics 2025 36% – share of online shoppers who started their product search on Google in 2025 – ElectroIQ Google Shopping statistics 65% of clicks on commercial (buy-intent) keywords go to paid Google Ads results vs. 35% to organic – DemandSage Google Ads statistics 2026 19% of users who search for a product click on a Google Shopping result – ElectroIQ Google Shopping statistics |
Google advertising revenue (2025-2026)
Google Ads (the entire advertising segment) generated USD 294.68 billion in revenue in 2025, up from USD 264.5 billion in 2024. Q4 2025 alone generated USD 82.3 billion. Google holds approximately 26.4% of the global digital advertising market – though Meta overtook Google in total ad share for the first time in 2025.
| Google advertising revenue – key statistics USD 294.68 billion – total Google advertising revenue in 2025 (+11.4% YoY) – DemandSage Google Ads statistics 2026 / Alphabet USD 264.5 billion – Google advertising revenue in 2024 – DemandSage Google Ads statistics 2026 USD 82.3 billion – Google advertising revenue in Q4 2025 alone – SQ Magazine Google Ads statistics USD 248 billion+ – projected Google ad revenue in 2026 (analysts’ estimate) – Digital Applied Google Ads benchmarks 2026 26.4% – Google’s share of the global USD 750 billion digital advertising market in 2025 – SQ Magazine / eMarketer Meta overtook Google in total ad share for the first time in 2025 (26.8% vs 26.4%) – SQ Magazine / eMarketer 365.74% – growth in Google Ads revenue over the past decade – DemandSage Google Ads statistics 2026 76% of all retail search ad spend allocated to Google Shopping Ads (not standard text search) – DemandSage / WebFX 2026 85% of all clicks on retail Google Ad campaigns come from Shopping formats – WebFX Google Ads statistics 2026 USD 2 in revenue for every USD 1 spent on Google Ads (average ROI across all industries) – Rudys.ai Google Ads benchmarks |
Google advertising revenue trajectory (2020-2026)
| Year | Google Ads revenue (USD) | YoY growth |
| 2020 | USD 146.9 billion | +13.3% |
| 2021 | USD 209.5 billion | +42.6% |
| 2022 | USD 224.5 billion | +7.2% |
| 2023 | USD 237.9 billion | +5.9% |
| 2024 | USD 264.5 billion | +11.2% |
| 2025 | USD 294.7 billion | +11.4% |
| 2026 (forecast) | USD 248B+ (conservative) / USD 300B+ (analyst high) | ~9-12% |
Sources: Alphabet SEC filings, DemandSage Google Ads statistics, Rudys.ai Google Ads benchmarks 2026

Google Shopping click-through rate (CTR) benchmarks (2026)
The average CTR for Google Shopping Ads is 0.86%. This is lower than text search ads (average 3.17-4.10% for ecommerce) because Shopping ads are highly visual and appear to a broader audience – but the buyers who do click on Shopping ads are significantly more purchase-ready than typical search visitors.
| CTR benchmarks – key statistics 0.86% – average CTR for Google Shopping Ads (Product Listing Ads / PLA format) – Store Growers Shopping Ads benchmarks / WebFX 2026 Above 1.2% CTR on Shopping is considered strong performance for most categories – OwlClaw Google Shopping benchmarks 2026 3.17% – average CTR for Google Search Ads across all industries – DemandSage / WebFX 2026 4.10% – average CTR for ecommerce Search campaigns specifically (above overall average) – Ryze AI Google Ads benchmarks 2026 1.25% – average CTR for Bing/Microsoft Shopping Ads (higher than Google Shopping) – Store Growers Shopping Ads benchmarks 2026 Overall average Search CTR climbed to 3.52% in Q1 2026, continuing a three-year upward trend driven by AI-generated ad assets and improved formats – Digital Applied Google Ads benchmarks Q1 2026 CTR improved across all 14 measured ecommerce industries in 2025, with ecommerce growing +7.49% YoY – Triple Whale 2025 Google Ads benchmarks Shopping ads are responsible for 85% of all retail clicks on Google, despite lower per-impression CTR – WebFX / DemandSage 2026 |
Google Shopping CTR by category (approximate benchmarks)
| Category | Typical Shopping CTR | Notes |
| Apparel and fashion | 0.9-1.3% | Highly visual; strong impulse click driver |
| Consumer electronics | 0.5-0.9% | Research-heavy; comparison shopping reduces CTR |
| Home and garden | 0.7-1.1% | Seasonal peaks; lifestyle imagery drives CTR |
| Sports and outdoor | 0.8-1.2% | Above average for well-optimised feeds |
| Toys and games | 0.9-1.4% | Strong seasonal (Q4); gift purchase context |
| Beauty and personal care | 0.8-1.2% | Repeat purchase category; strong mobile CTR |
| Books and media | 0.5-0.8% | Commodity; price comparison dominant |
Sources: OwlClaw Google Shopping benchmarks 2026, Store Growers Shopping Ads benchmarks, WordStream 2025 benchmarks
Google Shopping CPC benchmarks (2026)
The average CPC for Google Shopping Ads is USD 0.66 globally – significantly lower than the USD 2.96 cross-industry average for Search Ads in Q1 2026. In European ecommerce campaigns, Shopping CPC averages approximately EUR 0.36, with Performance Max campaigns blending in at EUR 0.41. CPCs have risen 12% year-on-year for Search while Shopping CPC remained more stable at approximately 1% annual increase.
| CPC benchmarks – key statistics USD 0.66 – average CPC for Google Shopping Ads globally – WebFX / DemandSage / OwlClaw 2026 USD 1.16 – average CPC for ecommerce Search campaigns (1.76x higher than Shopping) – Ryze AI Google Ads cost benchmarks 2026 USD 2.96 – cross-industry average Search CPC in Q1 2026 (+12% YoY from USD 2.64 in Q1 2025) – Digital Applied Google Ads benchmarks Q1 2026 EUR 0.36 – average Shopping CPC in European ecommerce campaigns – Ryze AI Google Ads cost benchmarks 2026 EUR 0.41 – average Performance Max CPC in European retail campaigns – Ryze AI Google Ads cost benchmarks 2026 EUR 0.42 – average Search CPC in European ecommerce campaigns – Ryze AI Google Ads cost benchmarks 2026 USD 1.20+ – Shopping CPC for competitive electronics categories (well above average) – OwlClaw Google Shopping benchmarks 2026 +1% YoY – Shopping CPC change in Q1 2025 (stable vs +5% YoY for Search CPC) – Search Engine Land Q1 2025 Google ad spend report +8% YoY – Shopping ad spend growth in Q1 2025, with click volume up 9% YoY – Search Engine Land Q1 2025 Google ad spend report USD 6.75 – Legal services CPC (highest industry); USD 1.16 ecommerce (lowest major category) – Ryze AI / Digital Applied benchmarks 2026 |
CPC comparison: Shopping vs Search vs Performance Max (2026)
| Campaign type | Global avg. CPC | EU ecommerce avg. CPC | vs Search |
| Google Shopping (Standard) | USD 0.66 | EUR 0.36 | 77% cheaper than Search |
| Performance Max (blended) | USD 0.80-1.20 (est.) | EUR 0.41 | ~60% cheaper than Search |
| Google Search (ecommerce) | USD 1.16 | EUR 0.42 | Baseline |
| Google Display | USD 0.44 | EUR 0.15-0.30 (est.) | 85% cheaper than Search |
| Cross-industry Search avg. | USD 2.96 | N/A | 155% more expensive than ecommerce Search |
Sources: Ryze AI Google Ads cost benchmarks 2026, Digital Applied Google Ads benchmarks Q1 2026, OwlClaw Google Shopping benchmarks 2026

Google Merchant Center statistics and updates (2026)
Google Merchant Center (GMC) is the free platform that connects product feeds to all Google shopping surfaces – Search, Shopping tab, Images, Maps, and YouTube. Products submitted to GMC can appear as both free listings and paid Shopping Ads. Feed quality and data completeness are the primary signals determining both approval status and organic ranking in Shopping results.
| Google Merchant Center – key facts and statistics Google Merchant Center is free to use – creating an account and submitting products generates free listings across Google Search, Shopping tab, Images, and Maps – Google for Retail – Merchant Center 1 billion+ products listed in Google Shopping as of 2024 (latest publicly available figure) – ElectroIQ Google Shopping statistics Over 8 million active advertisers use Google Ads, and Merchant Center is required for all Shopping and Performance Max product campaigns – Rudys.ai / Digital Applied 2026 76% of retail search ad spend in the US directed to Shopping Ads – all flowing through product feeds submitted to GMC – DemandSage / Shopify GMC guide Free product listings in GMC generated billions of clicks globally in 2025 for small businesses – Google Merchant Center USA guide GMC now includes Popular Products insights, Price Competitiveness reports, and Online Store visitor behaviour reports as built-in analytics (no Google Ads required) – JumpFly Merchant Center analytics guide Google’s new Universal Commerce Protocol (UCP) announced in 2025 is designed to let AI agents discover and purchase products from GMC-listed inventories directly – Productsup GMC guide 2025 93% of retailers run Performance Max for Shopping campaigns in 2025; PMax absorbed 53% of Shopping ad spend in Q1 2025 – Search Engine Land Google ad spend Q1 2025 |
Most common reasons for product disapproval in Google Merchant Center
| Disapproval reason | Why it happens | How to fix it |
| Missing or invalid GTIN | Using internal SKUs; EAN not registered in GS1 database | Register GTINs via GS1; apply for GTIN exemption for custom products |
| Price mismatch | Feed price differs from price shown on landing page | Ensure feed updates within 24-48h; use automatic item updates in GMC |
| Inaccurate product data | Titles/descriptions do not match landing page content | Use consistent data between feed and product pages; enable structured data |
| Image quality issues | White background requirement not met; low resolution; watermarks | Minimum 100×100 px (800×800 recommended); white/light background; no text overlays |
| Restricted product category | Listing products in age-restricted, regulated, or policy-violating categories | Check GMC policy list; apply for restricted category access where available |
| Missing required attributes | Category-specific attributes (size, colour, material) absent from feed | Consult GMC attribute guide for your category; add required fields to feed |
| Availability mismatch | Product shows as in-stock in feed but out-of-stock on website | Implement automatic updates or increase feed refresh frequency to every 5-15 minutes |
Google Shopping conversion rate benchmarks (2026)
The average Google Shopping conversion rate is 1.91%. This is lower than the 3.17% average for Search campaigns because Shopping reaches a broader discovery audience rather than users typing exact purchase-intent queries. However, Shopping ad clicks convert at 30% higher rates than comparable text ad clicks when the product and price are clearly visible.
| Conversion rate benchmarks – key statistics 1.91% – average conversion rate for Google Shopping Ads globally – OwlClaw / WebFX / DemandSage 2026 3.17% – average conversion rate for Google Search Ads (all industries) – DemandSage Google Ads statistics 2026 4.4% – average conversion rate across all Google Ads formats (broader metric) – DemandSage Google Ads statistics 2026 Shopping Ads drive 30% higher conversion rates than text ads for the same product queries – Bind.media / ElectroIQ Shopping statistics 2025 People who click on Google Ads are 50% more likely to buy than organic visitors – DemandSage Google Ads statistics 2026 Conversion rate dropped YoY in 13 of 14 industries in 2025 (-9.28% median across Triple Whale brands), while CTR improved – indicating a growing gap between ad promise and landing page delivery – Triple Whale 2025 Google Ads benchmarks 65% of Google Ads industries saw better conversion rates in 2025 according to WordStream (conflicting data – WordStream measures all-industry averages, Triple Whale measures ecommerce DTC specifically) – WordStream 2025 Google Ads benchmarks 43% of users who saw a Google ad went on to buy the advertised product (brand ad study) – DemandSage Google Ads statistics 2026 |
Conversion rate by ad format (2026)
| Format | Average CVR | Key driver |
| Google Shopping Ads | 1.91% | Visual discovery; price visible before click = higher purchase intent |
| Google Search Ads | 3.17% | High purchase intent queries; user is already searching to buy |
| Performance Max (blended) | 2-4% (est.) | Varies; blends high-intent Search with lower-intent Display and YouTube |
| Google Display Ads | 0.46% | Awareness/retargeting; audience not in active purchase mode |
Sources: DemandSage Google Ads statistics 2026, OwlClaw Google Shopping benchmarks 2026, Digital Applied Google Ads benchmarks Q1 2026

Google Shopping industry benchmarks: ROAS, CPA, and Performance Max (2026)
Top-quartile ecommerce brands achieve 6x ROAS on Google Shopping. Performance Max campaigns deliver 15-20% higher ROAS than Standard Shopping in most categories. The median ROAS across all Google Ads fell 10.03% in 2025 as CPCs rose faster than conversion efficiency, reflecting a more competitive auction environment.
| ROAS and campaign performance – key statistics 6x ROAS – top-quartile ecommerce brands on Google Shopping in 2026 – OwlClaw Google Shopping benchmarks 2026 Performance Max Shopping achieves 15-20% higher ROAS than Standard Shopping for most categories – OwlClaw Google Shopping benchmarks 2026 3.68 – median ROAS across all Google Ads campaigns in 2025 (Triple Whale brands), down -10.03% YoY – Triple Whale 2025 Google Ads benchmarks USD 23.74 – median CPA across all Google Ads campaigns in 2025 (+12.35% YoY from USD 21.13) – Triple Whale 2025 Google Ads benchmarks 78% of all Google Ads spend now uses Smart Bidding (Target CPA, Target ROAS, PMax) in 2026 – Digital Applied Google Ads benchmarks Q1 2026 34% of total Google Ads budgets absorbed by Performance Max in 2026 (up from 22% in 2025) – Digital Applied Google Ads benchmarks Q1 2026 71% of Google advertisers used Performance Max in 2025 (up from 60% in 2024) – Rudys.ai Google Ads benchmarks 2026 Advertisers using AI bidding strategies report 22% lower cost per conversion vs. manual CPC – Digital Applied / OwlClaw 2026 Accounts spending under USD 5,000/month saw 18% higher CPCs and 31% lower conversion rates than the median – AI bidding advantages concentrate in larger accounts – Digital Applied Google Ads benchmarks Q1 2026 Amazon maintained ~60% impression share in US Google Shopping auctions in Q1 2025 – the dominant competitive pressure for most retail categories – Search Engine Land Q1 2025 |
Google Shopping benchmarks by ecommerce category (2026)
| Category | Avg. CTR | Avg. CPC (USD) | Avg. CVR | Typical ROAS range |
| Apparel and fashion | 0.9-1.3% | 0.45-0.75 | 1.5-2.5% | 4x-8x |
| Consumer electronics | 0.5-0.8% | 0.80-1.50 | 1.2-2.0% | 3x-6x |
| Home and garden | 0.7-1.1% | 0.50-0.90 | 1.5-2.5% | 4x-7x |
| Sports and outdoor | 0.8-1.2% | 0.55-1.00 | 1.8-3.0% | 4x-8x |
| Beauty and personal care | 0.8-1.2% | 0.40-0.80 | 2.0-3.5% | 5x-10x (high repeat) |
| Toys and games | 0.9-1.4% | 0.45-0.70 | 1.8-3.0% | 4x-8x (seasonal peak) |
| Books and media | 0.5-0.8% | 0.20-0.50 | 2.0-3.5% | 3x-6x (low AOV) |
Sources: OwlClaw Google Shopping benchmarks 2026, Store Growers Shopping Ads benchmarks, WordStream 2025 Google Ads benchmarks, These are industry averages – individual account performance varies significantly based on feed quality, bid strategy, and landing page optimisation.
Key Takeaways
Google Shopping generates the highest ROAS of any paid ad format for product-based businesses – typically 15-20% higher than text search ads for the same products.
Average Shopping CPC (USD 0.66) is dramatically lower than average Search CPC (USD 2.96 in 2026) – but conversion rates also differ, making direct comparison more complex.
Performance Max has consolidated Shopping, Display, Search, and YouTube spend into single campaigns for 71% of Google advertisers in 2025, blurring channel-specific benchmarks.
Feed quality is the primary ranking signal for Shopping ads. Products with complete, accurate, and optimised titles, GTINs, and images consistently outperform on both impressions and CTR.1.2 billion monthly searches happen on Google Shopping.
36% of all online product searches in 2025 began on Google.
What drives Google Shopping ROAS above the median
| Highest-impact optimisation levers, ranked by typical ROAS lift Feed quality: complete titles (brand + product type + key attributes + colour/size), accurate GTINs, and optimised images are the highest-leverage single factors – poor feeds cannot be compensated by bid strategy alone. Campaign segmentation: separating high-margin and low-margin products into separate campaigns with different ROAS targets prevents budget from flowing to unprofitable SKUs.Performance Max for top SKUs: PMax delivers 15-20% higher ROAS than Standard Shopping for most ecommerce categories, particularly for the top 20% of revenue-generating products. Negative keyword management: Shopping campaigns benefit from negative keyword lists (applied at campaign or ad group level) to exclude non-commercial queries. Smart Bidding with sufficient conversion history: Target ROAS strategies require 30+ conversions of history before tightening targets; new campaigns should use Maximize Conversion Value until data accumulates. |
| Distribute optimised product feeds to Google Shopping and 500+ other channels Koongo connects your Shopify, WooCommerce, or Magento store to Google Shopping and 500+ advertising, comparison, and marketplace channels with correctly formatted, automatically updated product feeds. Feed quality is the highest-leverage factor in Shopping performance – Koongo’s Rules Editor handles attribute transformation without any coding. Permanent Free Plan. Paid plans from EUR 12/month. 7-day free trial, no credit card required. |