

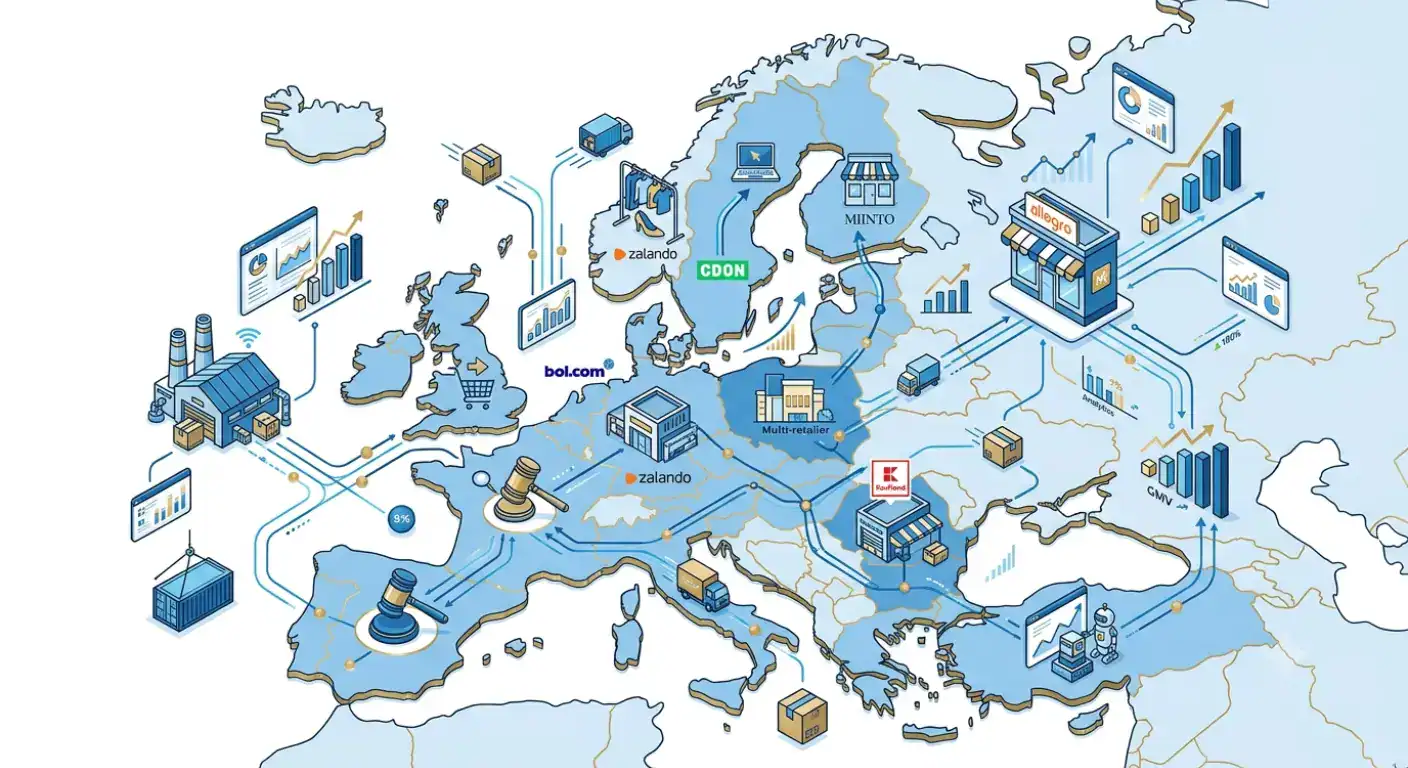
All statistics are sourced from official company earnings reports, annual reports, and verified third-party research including Marketplace Pulse, ECDB, Lengow, and primary company disclosures. Data reflects the most recent available figures as of mid-2026.
| TL;DR Amazon surpassed USD 800 billion in total GMV in 2025, with third-party sellers now representing 62% of all units sold and 69% of total GMV. eBay reported USD 79.6 billion in GMV and 135 million active buyers for full-year 2025, with Q1 2026 GMV growing 18% year-on-year. Zalando reached a record 62 million active customers and EUR 17.6 billion in GMV in 2025, growing 14.7% year-on-year. Allegro advanced to 21 million group active buyers with Polish GMV growing at 8.6% year-on-year – more than double Poland’s overall retail growth. Kaufland Global Marketplace attracted up to 43 million monthly visitors across all countries, with overall network GMV growing 11.9% in 2025 and international GMV up 124%. |
Marketplaces now account for more than 60-67% of all global ecommerce sales – and for European merchants, understanding the specific platforms that serve their customers is more useful than global aggregates. This article compiles key statistics for each major European marketplace from their most recent official reports and verified research sources, so you can benchmark each platform’s scale, growth, and seller dynamics in one place.
Every figure here is attributed to its primary source, with direct links where available. Where exact numbers are not publicly disclosed (as with bol.com, which is a subsidiary of Ahold Delhaize and does not publish separate annual reports), we use the most reliable third-party estimates and note the methodology.
Obsah
- European marketplace comparison at a glance (2026)
- Amazon marketplace statistics (2026)
- eBay statistics (2026)
- bol.com statistics (2026)
- Zalando statistics (2026)
- Allegro statistics (2026)
- Kaufland Marketplace statistics (2026)
- Miinto statistics (2026)
- CDON statistics (2026)
- Regional marketplace trends (2026)
European marketplace comparison at a glance (2026)
The eight marketplaces in this comparison collectively serve over 300 million active customers across Europe. Amazon, Zalando, and eBay are the largest by GMV; Allegro is the dominant platform in Poland; bol.com leads in the Netherlands and Belgium; Kaufland is the fastest-growing generalist marketplace in Central Europe.
| Marketplace | GMV / Revenue | Active buyers/customers | Markets | Category focus | Key 2025 stat |
| Amazon EU | USD 830B+ (total GMV) | 310M+ (global) | 8 EU countries via one account | All categories | 3P sellers = 62% of units, 69% of GMV |
| eBay | USD 79.6B GMV | 135 million | 190+ markets, 49% international revenue | All; electronics/collectibles strong | Q1 2026 GMV +18% YoY |
| Zalando | EUR 17.6B GMV | 62 million (record) | 25 European countries | Fashion, footwear, beauty, home | GMV +14.7%, revenue +16.8% in 2025 |
| Allegro | ~PLN 70B GMV (~EUR 16B) | 21 million (group) | PL, CZ, SK, HU | Electronics, fashion, home | Polish GMV +8.6% YoY; intl. GMV +60% |
| bol.com | ~USD 8.8B (ECDB est.) | 13M+ (NL + BE) | Netherlands, Belgium | Electronics, books, home, fashion | Revenue +10-15% in 2025 (ECDB est.) |
| Kaufland | USD 2.3B (ECDB est.) | 43M monthly visitors | DE, AT, CZ, SK, PL, RO, FR, IT | DIY, home, electronics | Network GMV +11.9%; intl. GMV +124% |
| Miinto | Not publicly disclosed | Active in 7 countries | DK, NO, SE, PL, NL, BE, CH | Fashion boutiques | Koongo premium partner; boutique focus |
| CDON | SEK 1.8B GMV (~EUR 166M) | 2 million+ | SE, NO, DK, FI | Electronics, home, fashion | 88% Nordic brand recognition |
Sources: Official company annual reports and earnings disclosures, ECDB, Lengow marketplace analysis, Marketplace Pulse
Amazon marketplace statistics (2026)
Amazon surpassed USD 800 billion in total GMV in 2025. Third-party sellers now represent 62% of all units sold and approximately 69% of total GMV. The seller base has consolidated to 1.65 million active sellers globally, down from 2.4 million at peak, but revenue per active seller has risen significantly.
| Amazon – key statistics (2025-2026) USD 830B+ total GMV in 2025: USD 575B third-party GMV (+15% YoY) + USD 255B first-party retail GMV (-2% YoY) – Marketplace Pulse / AMZPrep 61-62% – share of Amazon paid units sold by third-party sellers in 2025 (all-time record reached in Q3 2025 at 62%) – Amazon Quarterly Reports via eComBrainly 69% – third-party sellers’ share of total Amazon GMV, up from 60% in 2019 – Marketplace Pulse USD 172.2 billion – Amazon revenue from third-party seller services in 2025 (+11% YoY) – AMZPrep seller statistics USD 68.6 billion – Amazon advertising revenue in 2025 (+22% YoY); Q4 2025 alone: USD 21.3B – AMZPrep / Quantumrun USD 638 billion – Amazon total net sales in 2025; Q4 2025 revenue: USD 187.1B (+11% YoY) – AMZPrep marketplace 2025 analysis 1.65 million – active sellers globally at end of 2025, down from 2.4M in 2021 (consolidation) – SentryKit / Navos Agent 100,000 – Amazon sellers generating USD 1 million+ in annual revenue in 2025 (+67% since 2021) – Navos Agent annual seller report 1.6% of active US sellers generate 50% of US third-party GMV – revenue concentration accelerating – SentryKit marketplace statistics 2026 35.7% – Amazon’s share of the USD 1.2 trillion US ecommerce market in 2025 – Marketplace Pulse / Quantumrun 310 million+ – estimated global active customer accounts (not officially disclosed) – SalesDuo Amazon statistics 2026 |
Amazon third-party seller share growth (2019-2025)
| Year | 3P unit share | 3P GMV share | 3P seller services revenue |
| 2019 | ~53% | 60% | USD 54.0B |
| 2021 | ~56% | ~63% | USD 103.4B |
| 2023 | ~60% | ~66% | USD 140.1B |
| 2024 | ~61% | ~68% | USD 155.1B |
| 2025 | 61-62% (record) | 69% | USD 172.2B |
Sources: Marketplace Pulse, AMZPrep, Amazon annual reports via eComBrainly
For European merchants, Amazon’s European infrastructure covers eight marketplaces (amazon.de, amazon.fr, amazon.it, amazon.es, amazon.nl, amazon.pl, amazon.se, amazon.co.uk) from a single European seller account. German operations are by far the largest European storefront, with Amazon holding 35.7% of German ecommerce market share. The shift from first-party to third-party selling is structural and continuing – Amazon is explicitly transitioning from retailer to platform operator.

eBay statistics (2026)
eBay reported USD 79.6 billion in GMV and USD 11.1 billion in revenue for full-year 2025 – a 7% and 8% increase respectively. Q1 2026 continued the acceleration: GMV grew 18% year-on-year to USD 22.2 billion and revenue rose 19% to USD 3.1 billion. eBay had 135 million active buyers globally at end of 2025 and 2.5 billion live listings.
| eBay – key statistics (2025-2026) USD 79.6 billion – eBay full-year 2025 GMV (+7% YoY) – eBay FY2025 Annual Report (SEC 10-K) USD 11.1 billion – eBay full-year 2025 revenue (+8% YoY) – eBay FY2025 Annual Report (SEC 10-K) 135 million – active buyers worldwide at December 31, 2025 – eBay FY2025 Annual Report (SEC 10-K) 2.5 billion – live listings on eBay globally at December 31, 2025 – eBay FY2025 Annual Report (SEC 10-K) 51% of eBay’s 2025 GMV generated outside the United States (international majority) – eBay FY2025 Annual Report (SEC 10-K) USD 22.2 billion – Q1 2026 GMV (+18% YoY on reported basis) – eBay Q1 2026 Results (SEC 8-K) USD 3.1 billion – Q1 2026 revenue (+19% YoY on reported basis) – eBay Q1 2026 Results (SEC 8-K) 49% of recent quarterly revenue from international operations – eBay statistics – expanded ramblings 16 million – eBay’s estimated high-frequency enthusiast buyers (USD 800+ annual spend) – Podbase eBay statistics 2026 USD 544 million – eBay advertising revenue in 2025 – Podbase eBay statistics 2026 |
eBay’s Q1 2026 acceleration (+18% GMV) was significantly above its long-term trajectory and marked the platform’s strongest quarterly growth in several years. The platform is strongest in electronics, collectibles, automotive parts, and fashion. Its pre-owned and refurbished goods positioning gives it a sustainability narrative that drives engagement among Gen Z and Millennial buyers.
For European merchants, eBay.de is a major channel in Germany alongside Amazon. In the UK, eBay.co.uk remains one of the top-five ecommerce destinations by traffic. The platform’s 190+ market reach makes it one of the most internationally accessible starting points for merchants entering cross-border selling without marketplace-specific approval processes.
bol.com statistics (2026)
bol.com generated approximately USD 8.8 billion in total GMV in 2025, growing 10-15% from 2024’s USD 7.7 billion. It is the dominant marketplace in the Netherlands and Belgium, reaching more than 13 million active customers. The Netherlands accounts for 74% of bol.com revenues; Belgium is the secondary market at approximately 26%.
| bol.com – key statistics (2025-2026) USD 8.84 billion – bol.com total GMV in 2025 (+10-15% from 2024) – ECDB Bol company profile USD 7.72 billion – bol.com total GMV in 2024 (baseline) – ECDB Bol company profile 2024 EUR 5.9 billion – bol.com net consumer online sales in 2024 (company record at the time) – WORLDEF News / Ahold Delhaize disclosure EUR 3.1 billion – bol.com 2024 revenue (+8.7% YoY) per Ecommerce News reporting – Ecommerce News EU 13 million+ – estimated active customers in NL and BE (widely cited industry figure) – Industry consensus / Koongo partner data 74% Netherlands / 26% Belgium – revenue distribution between bol.com’s two markets in 2025 – ECDB Bol company profile 66% third-party GMV / 34% first-party – bol.com marketplace split in 2025 – ECDB Bol company profile Electronics = 25% of total bol.com sales in 2025 (largest single category) – ECDB Bol company profile USD 817 million – bol.com May 2026 monthly revenue (stable month-on-month trend) – ECDB Bol company profile |
Note on methodology: bol.com is a wholly-owned subsidiary of Ahold Delhaize and does not publish standalone annual reports. The figures above use ECDB transaction-based GMV estimates alongside Ahold Delhaize disclosures and Ecommerce News reporting. Different sources may show different figures depending on whether VAT is included and whether returns are deducted.
bol.com’s Silver Partner programme (of which Koongo is a certified member) represents the platform’s highest tier of integration partnership. Koongo’s bol.com integration uses the full native API, supporting product listing management, inventory synchronization, and order import with tracking confirmation.

Zalando statistics (2026)
Zalando reported EUR 17.6 billion in GMV and EUR 12.3 billion in B2C revenue in 2025, growing 14.7% and 16.8% respectively. Active customers reached a record 62 million across 25 European countries. The acquisition of ABOUT YOU in July 2025 contributed to results and is expected to generate EUR 100 million in annual synergies by 2029.
| Zalando – key statistics (2025-2026) EUR 17.6 billion – full-year 2025 GMV (+14.7% YoY), at the high end of guidance – Zalando FY2025 Fact Sheet EUR 12.3 billion – full-year 2025 B2C revenue (+16.8% YoY) – Zalando FY2025 Fact Sheet / TheIndustry.fashion EUR 591 million – 2025 adjusted EBIT (+15.6% YoY); margin stable at 4.8% group-wide – Zalando FY2025 Fact Sheet 62 million – active customers in 2025 (new record) – Zalando FY2025 Fact Sheet 25 European countries – geographic reach via single Zalando Partner account – Zalando Annual Report 2025 13% growth in Sports, Beauty, Kids and Designer categories in 2025 – TheIndustry.fashion Zalando 2025 results 90% AI-generated product content in 2025 (scaled from near zero in 2024) – TheIndustry.fashion Zalando 2025 results 6 million – Zalando Assistant app users in 2025 (4x increase year-on-year) – TheIndustry.fashion Zalando 2025 results EUR 19.7-20.6 billion GMV guidance for 2026 combined group (12-17% growth) – Zalando FY2025 Fact Sheet EUR 660-740 million – 2026 adjusted EBIT guidance for the combined group – Zalando FY2025 Fact Sheet |
Zalando’s acquisition of ABOUT YOU closed in July 2025, adding a second major European fashion marketplace to its portfolio while maintaining both brands separately. The combined group now processes product and order data at a scale that has established Zalando as, by its own account, the number one referred fashion platform by conversational AI tools – a positioning that reflects its investment in structured product data and AI-powered discovery.
Allegro statistics (2026)
Allegro reported group active buyers of 21 million and group GMV approaching PLN 70 billion (approximately EUR 16 billion) in 2025, growing at 9% year-on-year. Polish GMV grew 8.6% – more than double Poland’s overall retail growth of 4.4%. International marketplace GMV (Czech Republic, Slovakia, Hungary) grew 60% year-on-year.
| Allegro – key statistics (2025-2026) 21 million – group active buyers in 2025 (15.3 million in Poland + 5.7 million international) – Allegro Q4 2025 Results Presentation~ PLN 70 billion (~EUR 16 billion) – group GMV in 2025, growing at 9% YoY – Allegro Q4 2025 / Yahoo Finance earnings highlights PLN 12 billion – consolidated group revenue in 2025 (+11% YoY) – Allegro Q4 2025 Results Presentation 8.6% – Polish GMV growth in Q4 2025 YoY, versus 4.4% for Poland’s total retail sales – Allegro Q4 2025 Results Presentation 60% – international marketplace GMV growth in 2025 YoY (CZ, SK, HU) – Allegro Q4 2025 Results Presentation 4.6 million – international active buyers in 2025 (+40% YoY) – Yahoo Finance Allegro Q4 2025 earnings call 7.5 million Allegro Smart! members in Poland in 2025 (nearly 90% on paid subscriptions) – Yahoo Finance Allegro Q4 2025 earnings call 24% – Allegro advertising revenue growth in Q4 2025 YoY (reaching 2.24% of GMV) – Allegro Q4 2025 Results Presentation PLN 14 billion – loan origination by Allegro Pay in 2025 (+26% YoY) – Allegro Annual Report 2025 98% of Allegro GMV is third-party (merchant) sales; only 2% first-party in 2025 – ECDB Allegro company profile |
Allegro is the largest marketplace of European origin and the dominant platform in Poland, where it generates approximately 90% of its revenues. Its international expansion into Czech Republic, Slovakia, and Hungary is growing rapidly from a smaller base. The platform’s Allegro Smart! subscription model (analogous to Amazon Prime) drove higher purchase frequency and average spend per buyer throughout 2025.

Kaufland Marketplace statistics (2026)
Kaufland Global Marketplace attracted up to 43 million visitors monthly across all countries and reported overall network GMV growth of 11.9% in 2025. International marketplace GMV grew 124% as new markets in Poland, Austria, France, and Italy launched. The network now lists 45 million products from more than 15,000 sellers across nine European countries.
| Kaufland Global Marketplace – key statistics (2025-2026) 43 million – monthly visitors across all Kaufland marketplace countries – Kaufland at NRF Big Show Europe 2025 +11.9% – overall Kaufland network GMV growth in 2025 YoY – Marketplace Universe Kaufland internationalisation analysis +124% – international Kaufland marketplace GMV growth in 2025 YoY – Marketplace Universe Kaufland internationalisation analysis +439% – Kaufland.at (Austria) GMV growth in 2025 YoY following launch – Marketplace Universe Kaufland internationalisation analysis 5,000+ active sellers reached in both France and Italy within two months of launch – Marketplace Universe Kaufland internationalisation analysis 45 million products from 15,000+ sellers listed across all Kaufland marketplaces in 2026 – Marketplace Universe Kaufland internationalisation analysis 9 European countries covered as of 2026: DE, AT, CZ, SK, PL, RO, FR, IT + expansion to ES and NL announced – Marketplace Universe Kaufland 2026 32 million monthly visitors to kaufland.de alone (Germany) – Rithum / Nakoa Digital Kaufland overview +92% average annual GMV growth rate for Kaufland.de over five years (2015-2020) – Nakoa Digital Kaufland analysis USD 2.26 billion – Kaufland estimated annual GMV in 2025, with 5-10% growth projected in 2026 – ECDB Kaufland company profile |
Kaufland’s expansion trajectory is the most aggressive of any European marketplace in 2025-2026. From a German-only marketplace in 2020, it now operates in nine countries through a single seller account – making it the most accessible pan-European generalist marketplace for sellers targeting Central and Eastern Europe. Its parent company (Schwarz Group, which also operates Lidl) brings 99% brand recognition in its core markets, which translates into strong customer trust from the marketplace’s earliest days in each new country.
Miinto statistics (2026)
Miinto is a European fashion marketplace connecting shoppers with independent boutiques, operating across seven countries: Denmark, Norway, Sweden, Poland, the Netherlands, Belgium, and Switzerland. More than 900 Dutch boutiques are active on the platform. Miinto does not publicly disclose GMV or revenue figures.
| Miinto – key facts (2026)7 European countries: Denmark, Norway, Sweden, Poland, Netherlands, Belgium, and Switzerland – Follo Agency Miinto selling guide 900+ Dutch boutiques active on Miinto in 2026 – Follo Agency Miinto selling guide Founded in Denmark; strong in Scandinavia; expanding south and west into NL/BE – Follo Agency / Miinto Focus on independent fashion boutiques and branded fashion – not general merchandise or unbranded goods – Miinto platform policy Commission-based model; no published standard rate – negotiated individually per brand or boutique – Koongo partner programme data Koongo is a premium integration partner for Miinto – one of the most direct API connections available – Koongo partner status |
Miinto’s strategic value for fashion merchants is its positioning between Zalando (requiring full brand approval and editorial-quality content) and general marketplaces. It connects independent boutiques with shoppers across its seven markets, with particular strength in Scandinavia where it is one of the most established fashion platforms. For Dutch and Belgian fashion brands or boutique chains looking to expand into Norway, Sweden, or Denmark, Miinto provides a lower-barrier entry point than Zalando’s partner programme.
CDON statistics (2026)
CDON is the largest online marketplace in the Nordic region, founded in Sweden in 1999. It operates in Sweden, Norway, Denmark, and Finland, connecting over 1,500 merchants with more than 2 million customers. CDON is known to 88% of the Nordic population and attracted over 100 million visitors in 2025. Full-year 2024 GMV reached SEK 1.8 billion (approximately EUR 166 million).
| CDON – key statistics (2025-2026) 2 million+ active customers across the Nordic region (Sweden, Norway, Denmark, Finland) – CDON Investors – about CDON Group 1,500 vetted sellers on the platform in 2026 – CDON Investors / Lengow top marketplaces Sweden 88% – CDON’s brand recognition among the Nordic population – Lengow top marketplaces Sweden 2026 100 million+ annual visitors to CDON across all four Nordic markets – Lengow top marketplaces Sweden 2026 SEK 1.8 billion (~EUR 166 million) – CDON Group full-year 2024 GMV across all Nordic markets – Lengow top marketplaces Finland 2026 12 million+ products listed across electronics, home equipment, beauty, video games, kitchen appliances, and toys – Lengow top marketplaces Sweden 2026 EUR 29/month + 4-12% commission by category – CDON seller fee structure – Lengow top marketplaces Finland 2026 100% third-party marketplace – no competing own inventory – CDON Investors / Lengow analysis Monthly visits: 3.2M (Sweden), 1.4M (Norway), 838K (Finland), 539K (Denmark) – per SimilarWeb – Mulwi CDON marketplace guide |
CDON’s acquisition of Fyndiq in April 2023 created a combined Nordic marketplace group offering sellers two distinct audience profiles from a single corporate relationship: CDON for broad multi-category reach and Fyndiq for deal-focused and value-conscious shoppers. Together the CDON Group covers all four Nordic countries through one seller account. For European merchants expanding into Scandinavia, CDON is typically the first entry point given its combination of broad category acceptance, regional brand recognition, and straightforward onboarding.
Regional marketplace trends (2026)
The dominant regional trends for European marketplace selling in 2026 are: the ongoing consolidation of Amazon and Zalando at the top, rapid growth of Kaufland in Central and Eastern Europe, the expansion of social commerce via TikTok Shop across Western Europe, and the continued strength of regional specialists like Allegro in Poland and CDON in the Nordics.
Key regional trends by geography
| Region | Key trend (2026) | Dominant platforms |
| Netherlands | 94.4% ecommerce penetration; iDEAL transitioning to Wero; NL fastest CAGR in Western Europe (10.7%) | bol.com (#1), Amazon.de (via DE), Zalando (fashion) |
| Belgium | 30% of enterprise revenue from ecommerce; bilingual market; Benelux shopping patterns | bol.com (#1), Amazon.de, Zalando, Miinto |
| Germany | EUR 94B ecommerce market; Amazon holds 35.7% share; Kaufland growing as #2 generalist | Amazon.de (#1), eBay.de, Kaufland.de, Zalando (fashion), OTTO |
| Poland | EUR 35B market growing at 12%+; Allegro dominates with 35%+ market share | Allegro (#1), Amazon.pl (smaller), Kaufland.pl, Zalando |
| Nordics (SE/NO/DK/FI) | 88%+ online penetration; high average spend; sustainability and transparency driven | CDON (#1 generalist), Zalando (fashion), Amazon (via DE/SE), Miinto (boutique fashion) |
| Central Europe (CZ/SK/HU) | Kaufland and Allegro international expanding rapidly; local platforms still strong | Kaufland.cz/sk, Allegro (CZ/SK/HU), Amazon.de (cross-border) |
| Austria | Kaufland.at GMV +439% after 2025 launch; Amazon.de dominant from Germany | Amazon.de, Kaufland.at, Zalando |
Sources: Marketplace Universe Kaufland analysis, Lengow Germany marketplace map, Lengow Sweden top marketplaces 2026, Eightx EU ecommerce penetration 2026
TikTok Shop in Europe: the emerging channel to watch
TikTok Shop launched in Germany in April 2025 and is gaining traction in fashion and lifestyle categories. In Europe overall, TikTok surpassed 200 million monthly active users by September 2025. While TikTok Shop’s European GMV is not publicly disclosed, its 120% year-on-year global GMV growth and rapid seller acquisition signal that it will become a meaningful marketplace for fashion and beauty merchants in European markets by 2027.
| Connect your store to all these marketplaces from one platform Koongo connects your Shopify, WooCommerce, or Magento store to Amazon, bol.com, Zalando, Kaufland, eBay, Allegro, Miinto, CDON, and 490+ other channels via API-based integration – with order sync, inventory sync, and feed management in every paid plan. Permanent Free Plan. Paid plans from EUR 12/month. 7-day free trial, no credit card required. |