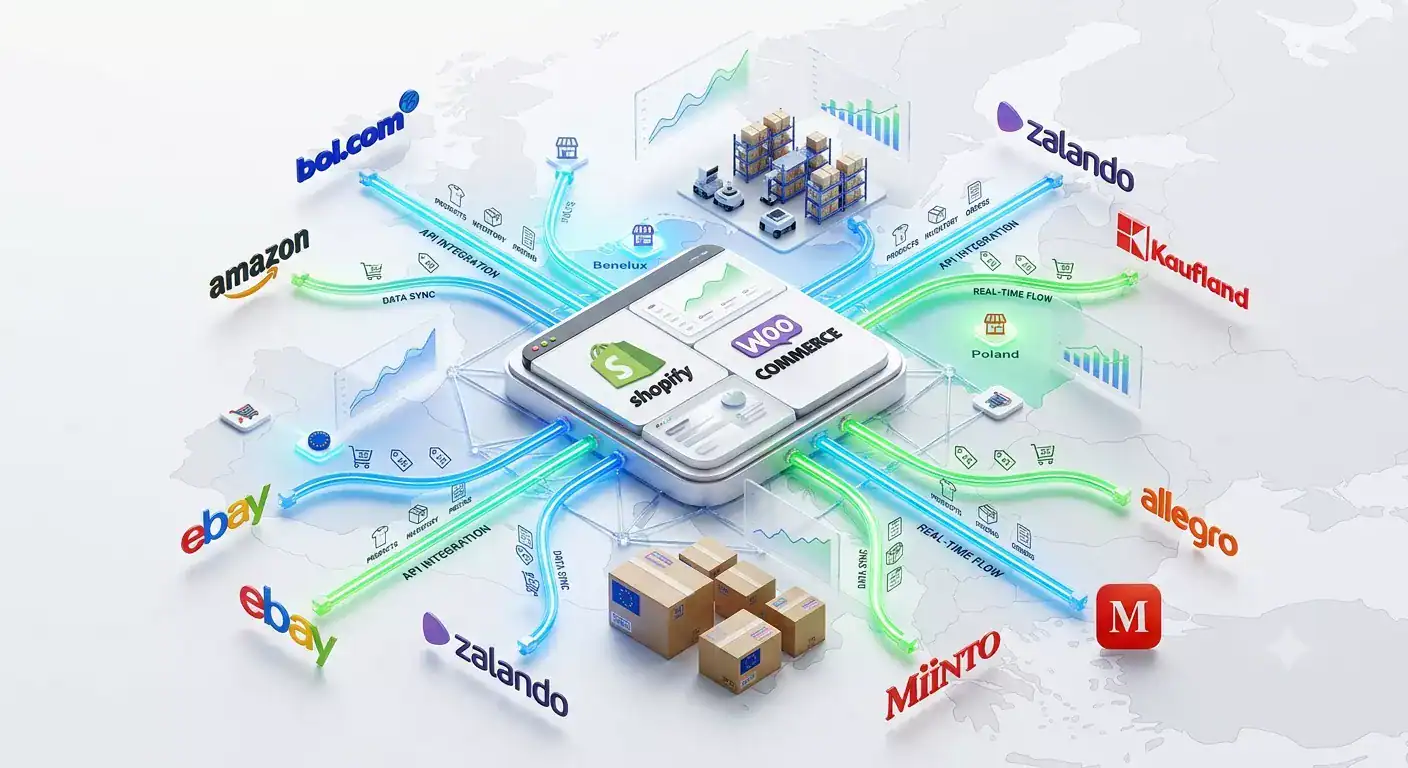
Master Selling on Marketplaces: Dive into our comprehensive guides to learn the ins and outs of various online marketplaces. From setting up shop to optimizing sales strategies, discover essential tips and tricks to maximize your success and stand out in the competitive digital marketplace.
It’s not long since the launch of Kaufland.nl in the Netherlands – and now the Spanish Kaufland marketplace is live too! This makes Kaufland Global Marketplace the largest marketplace network from Europe! The all-in-one solution now offers access to a total of nine markets and a potential 220 million online customers – all with just one registration. The best part – you manage all offer, product and order data from one portal. This keeps the extra effort required for each additional marketplace to a minimum.
Sell on up to 9 new marketplaces during the high season (with just one registration!) – start with Kaufland Global Marketplace now during the busiest time of the year and reach up to 220 million new online customers with just one account!!
Whether you’re a seller, a brand, or a global player – offer your products nationally and/or internationally in Germany, France, Italy, Spain, the Netherlands, Poland, Austria, the Czech Republic, and Slovakia, and expand your reach to tap into additional (cross-border) potential during the high season. On the Kaufland marketplaces, you can achieve immediate success even without extensive e-commerce experience.
The new Kaufland marketplace for the Netherlands is now live!
With just a single registration, Kaufland Global Marketplace sellers can now offer their products across eight European countries and reach up to 185 million potential customers.
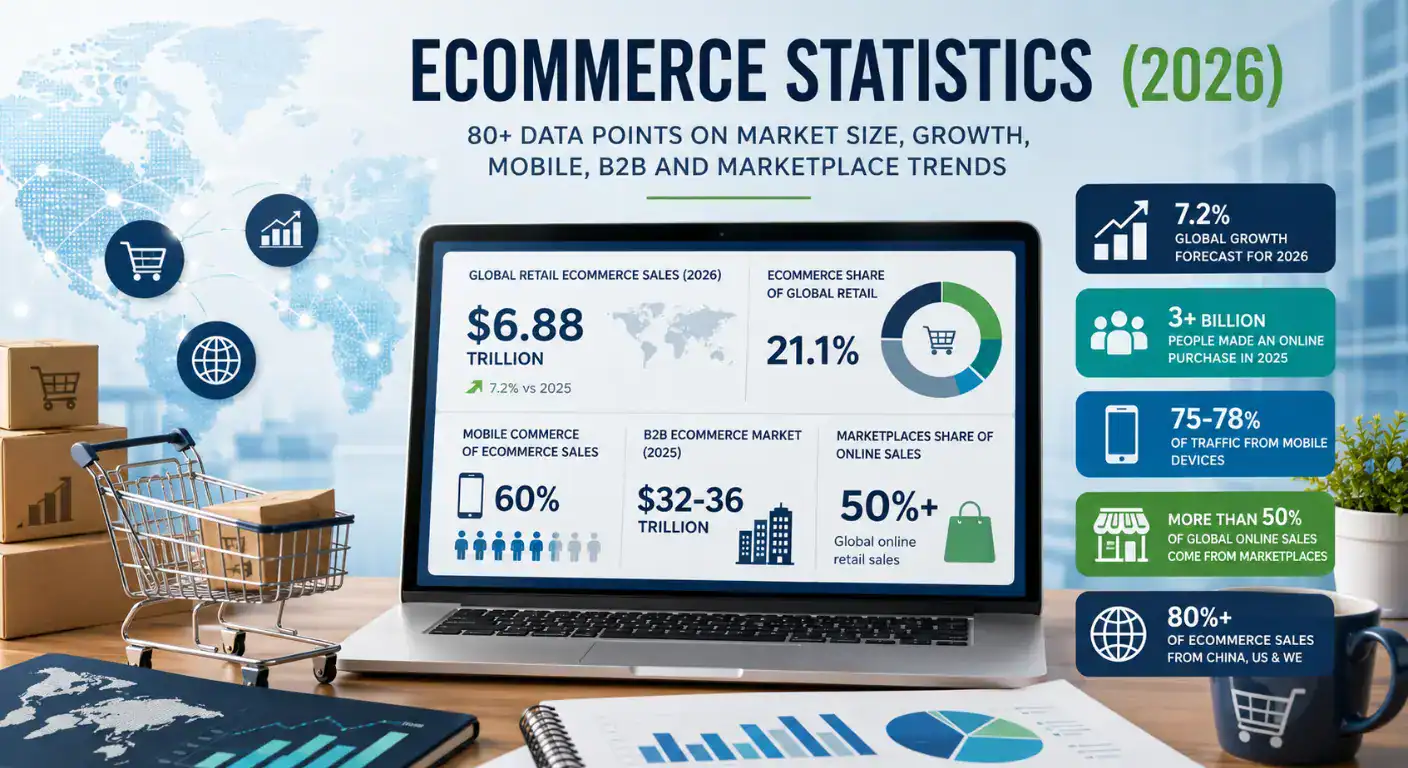
Global retail ecommerce sales are forecast to reach USD 6.88 trillion in 2026, representing 21.1% of total global retail.
European B2C ecommerce reached EUR 842 billion in 2024, growing 7% year-on-year, with the Netherlands, Germany, and France as the largest national markets after the UK.
Mobile commerce now accounts for approximately 60% of global ecommerce sales – smartphones generate 75-78% of traffic but still convert at roughly half the rate of desktop.
B2B ecommerce is 5-6x larger than B2C by total transaction value, with the global B2B market estimated at USD 32-36 trillion in 2025.
The ecommerce industry generates more data than almost any other sector – and most of it is contradictory, depending on how the source defines ecommerce (B2C only vs. B2B and C2C included; products only vs. services; retail only vs. all digital commerce). Understanding what the numbers actually measure matters before you use them for planning or comparison.
This article presents 80+ ecommerce statistics for 2026, clearly attributed to their source and scope. The figures are organised by theme: global market size, regional breakdown, growth trends, cross-border commerce, mobile, B2B, marketplace data, shopping behaviour, and future trends. Each section opens with the most frequently cited headline number, followed by the supporting data that provides context.
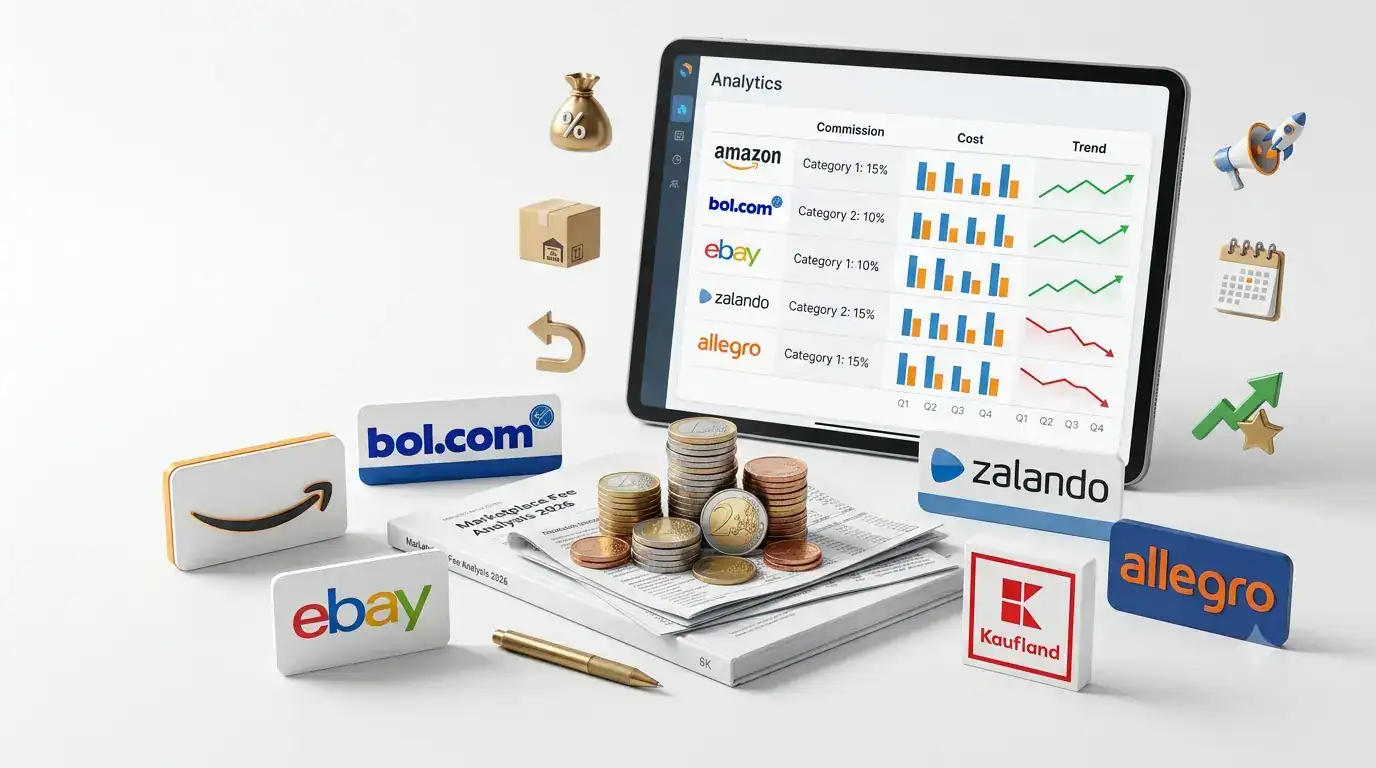
This comparison is based on publicly available fee schedules, official marketplace documentation, and verified third-party sources as of mid-2026. Fees change regularly. Always verify against your platform’s seller portal before making pricing decisions.
TL;DR
Commission fees across major European marketplaces range from 5% to 25% of the selling price, depending on category and platform. Amazon reduced its EU referral fees in early 2026 by an average of EUR 0.17 per unit, one of its largest-ever European fee cuts. Clothing now starts at 5% for items under EUR 15.
bol.com charges no monthly seller fee: you pay commission only when you sell. Rates run from 5% to 17% plus a fixed amount per transaction.
Zalando’s total selling cost is the highest of any platform reviewed here: commission of 8-25% plus a monthly fee of EUR 40, and additional marketing spend that partners call effectively mandatory for visibility.
The headline commission rate is never the full cost. FBA fulfillment, return processing, advertising, and monthly fees routinely add 10-20 percentage points to your effective cost per sale.
Marketplace fees are one of the most researched topics in e-commerce, and one of the most misunderstood. Most guides compare headline commission rates as if they were the only cost. In practice, the commission is one line in a fee stack that can include monthly seller fees, fulfillment costs, return processing fees, advertising spend, and payment processing charges.
This comparison covers the six most relevant marketplaces for European merchants: Amazon, bol.com, eBay, Zalando, Allegro, and Kaufland, with current 2026 rates, the hidden costs that rarely appear in overview tables, and a realistic total-cost model for a sample product to show what you actually pay per sale.
This comparison is based on publicly available product information, pricing pages, and user reviews as of mid-2026. Prices and features change. Verify with each vendor before purchasing.
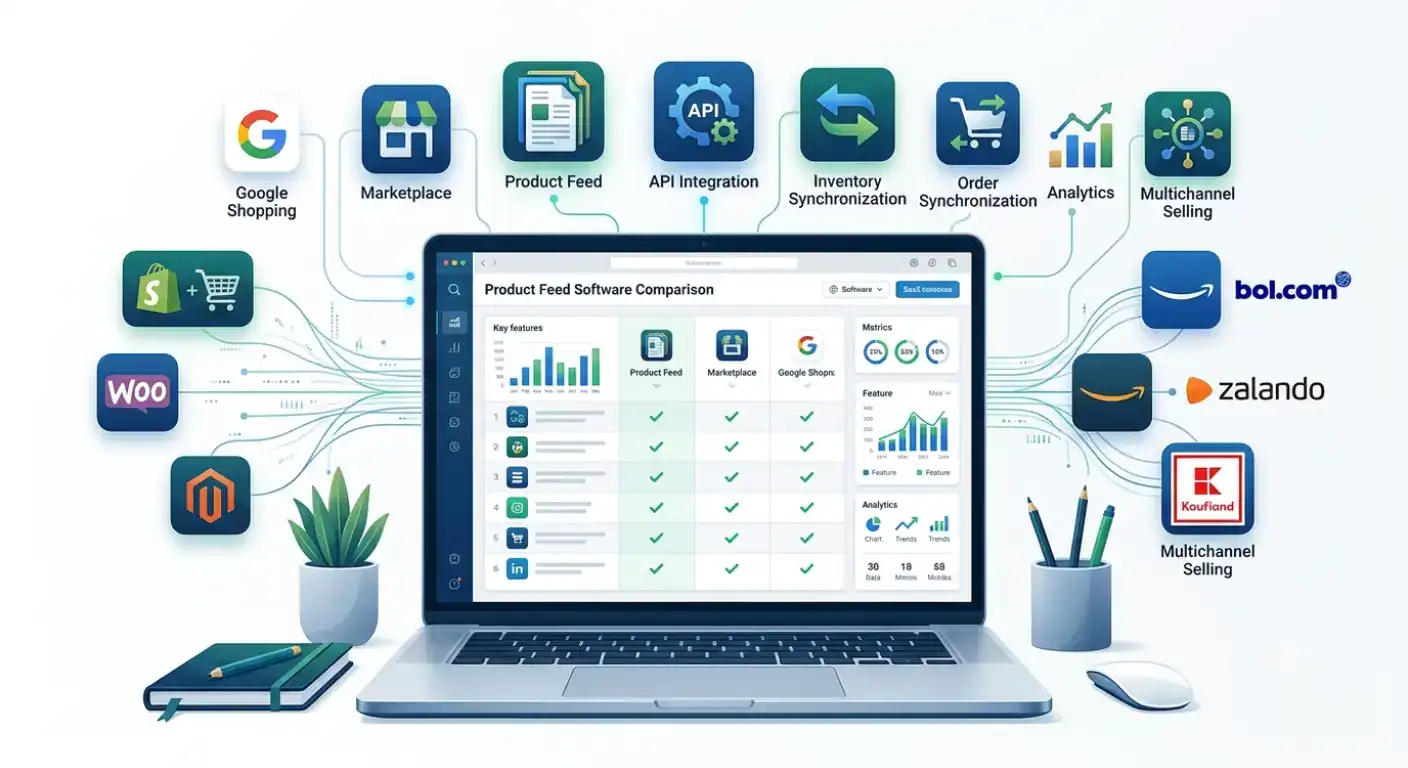
Product feed software eliminates that work. It connects to your store, applies transformation rules to match each channel’s requirements, and distributes your catalog automatically on a schedule. The question is which tool fits your specific combination of channels, store platform, team size, and budget.
This guide compares six tools across the features that actually matter for the decision: channel coverage, marketplace depth, pricing structure, ease of setup, and who each tool is genuinely best for.
There’s exciting news from Kaufland Global Marketplace: The Kaufland marketplace is expanding to Spain and the Netherlands later this summer. We’ve already laid the groundwork for you so you can quickly and easily tap into new markets!
Kaufland Global Marketplace offers you the largest marketplace network from Europe!
Register now and start selling across Europe with a single registration!
This comparison is based on publicly available product information, pricing pages, and verified user reviews as of mid-2026. Prices and feature sets change. Verify with each vendor before purchasing.
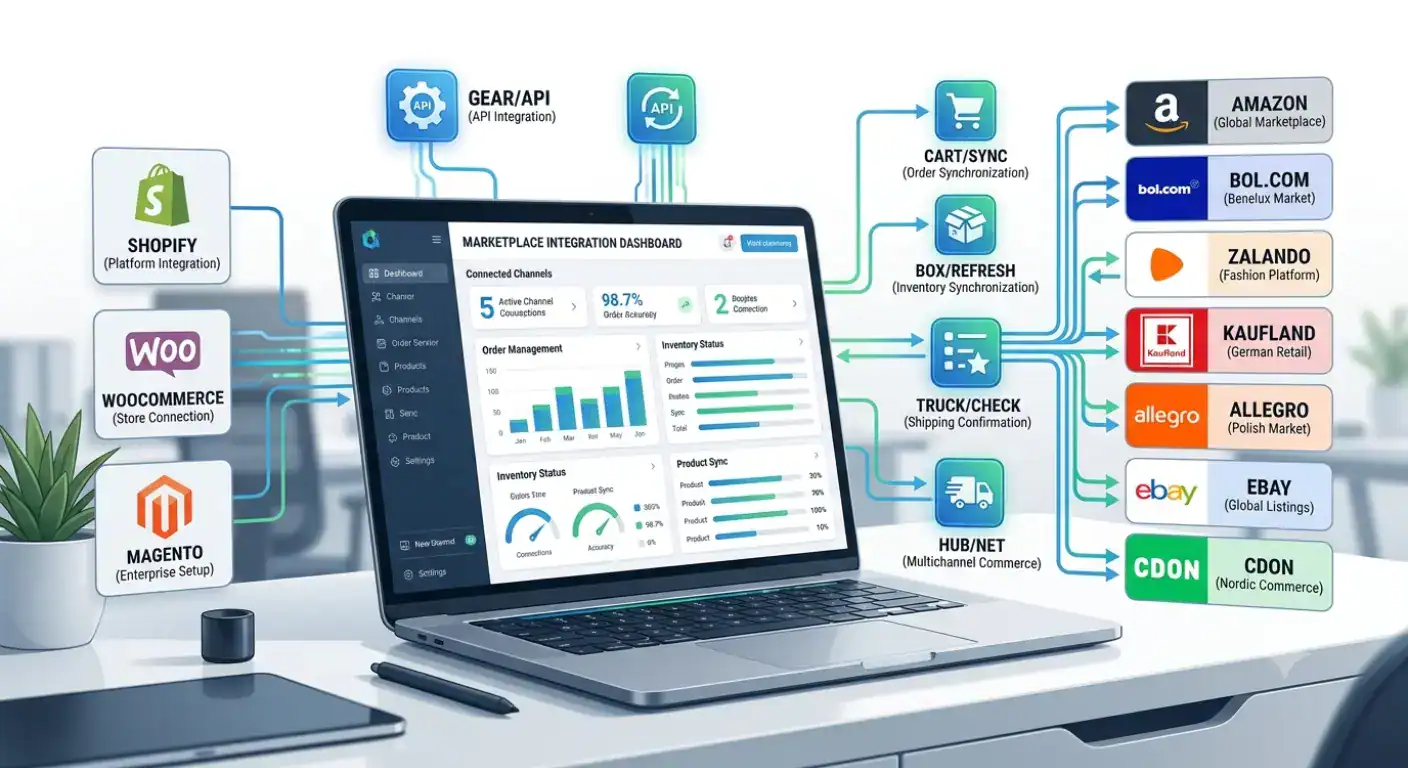
This guide focuses specifically on marketplace integration software: what it does, how the leading platforms compare across the features that matter for European merchants, and which tool fits which type of store.
Order synchronization is the feature that separates feed tools from true marketplace integration platforms: it imports marketplace orders into your Shopify or WooCommerce order workflow automatically.Inventory synchronization prevents overselling: when a unit sells on one channel, stock is updated across all others within minutes.
Comet, the British electricals name, is returning in 2026, this time as an online marketplace for tech and consumer electricals. If you sell electronics or appliances, it’s a channel worth getting ready for now, because sellers who join before launch will have their products live from day one.
Here’s what the new Comet is, why it’s a strong fit for tech and electricals sellers, the challenge of listing electronics on any marketplace, and how Koongo gets your catalogue ready ahead of launch.
In 2024, more than 60% of all online product searches in Europe started on a marketplace rather than a search engine. Amazon, bol.com, Zalando, and their peers have become the default product discovery layer for hundreds of millions of shoppers and for merchants, this creates both an opportunity and a strategic challenge.
The opportunity: instant access to an audience that would take years and significant ad spend to build on your own webshop. The challenge: each marketplace operates differently, charges differently, and requires your product data in a different format. Running three or four channels manually adds hours of work every week and introduces errors that cost you visibility, sales, and occasionally your seller account.
This guide covers everything you need to know about marketplace selling in 2026 from what a marketplace is and which ones matter for European merchants, through to how multichannel operations work at scale and what mistakes to avoid in your first 90 days.
Koongo uses cookies to improve your experience. By clicking “Accept”, you consent to the use of ALL the cookies. However, you may visit Cookie Settings to provide controlled consent. Cookie settingsACCEPT
Cookies
Privacy Overview
Koongo uses cookies to improve your experience while you navigate through the website. These cookies will be stored in your browser only with your consent. Learn more
Necessary cookies are absolutely essential for the website to function properly. This category only includes cookies that ensure the basic functionalities and security features of the website. These cookies do not store any personal information.
Cookie
Type
Duration
Description
_GRECAPTCHA
1
5 months 27 days
This cookie is set by Google. In addition to certain standard Google cookies, reCAPTCHA sets a necessary cookie (_GRECAPTCHA) when executed for the purpose of providing its risk analysis.
cookielawinfo-checkbox-advertisement
1
1 year
The cookie is set by GDPR cookie consent to record the user consent for the cookies in the category "Advertisement".
cookielawinfo-checkbox-analytics
1
1 year
This cookies is set by GDPR Cookie Consent WordPress Plugin. The cookie is used to remember the user consent for the cookies under the category "Analytics".
cookielawinfo-checkbox-live-chat
1
1 year
No description
cookielawinfo-checkbox-necessary
0
11 months
This cookie is set by GDPR Cookie Consent plugin. The cookies is used to store the user consent for the cookies in the category "Necessary".
cookielawinfo-checkbox-non-necessary
0
11 months
This cookie is set by GDPR Cookie Consent plugin. The cookies is used to store the user consent for the cookies in the category "Non Necessary".
cookielawinfo-checkbox-performance
1
1 year
This cookie is set by GDPR Cookie Consent plugin. The cookie is used to store the user consent for the cookies in the category "Performance".
gr
1
90 days
This cookie is used by Reditus Affiliate system. Reditus does not build a tracking profile - learn more.
intercom-device-id-tctfy2ty
persistent
9 months
First party cookie is set by Intercom for Messenger. Used to identify the device interacting with the Messenger in order to improve security.
intercom-id-tctfy2ty
persistent
9 months
First party cookie is set by Intercom for Messenger. Anonymous visitor identifier cookie. Allows visitors to see any conversations they've had on Koongo websites.
intercom-session-tctfy2ty
session
7 days
First party cookie is set by Intercom for Messenger. Allows users to access their conversations and have data communicated on logged out pages for 1 week. Identifier for each unique browser session. This session cookie is refreshed on each successful logged-in ping, extending it one week from that moment.
language
0
1 week
Cookie for the language selector on the website.
viewed_cookie_policy
0
11 months
The cookie is set by the GDPR Cookie Consent plugin and is used to store whether or not user has consented to the use of cookies. It does not store any personal data.
We use these cookies to allow live-chat on the website.
Cookie
Type
Duration
Description
__cfruid
1
session
This cookie is set by the provider Cloudflare. This cookie is used for load balancing and for identifying trusted web traffic.
AWSALBCORS
1
7 days
This cookie is used for load balancing services provded by Amazon inorder to optimize the user experience. Amazon has updated the ALB and CLB so that customers can continue to use the CORS request with stickness.
Analytical cookies are used to understand how visitors interact with the website. These cookies help provide information on metrics the number of visitors, bounce rate, traffic source, etc.
Cookie
Type
Duration
Description
_ga
0
2 years
This cookie is installed by Google Analytics. The cookie is used to calculate visitor, session, camapign data and keep track of site usage for the site's analytics report. The cookies store information anonymously and assigns a randoly generated number to identify unique visitors.
_gid
0
1 day
This cookie is installed by Google Analytics. The cookie is used to store information of how visitors use a website and helps in creating an analytics report of how the wbsite is doing. The data collected including the number visitors, the source where they have come from, and the pages viisted in an anonymous form.
_uv_id
session
2 years
The cookie is set by Google Analytics. The cookie is used to collects data on the user’s visits to the website, such as which pages have been read.
SL_C_23361dd035530_SID
0
2 years
This cookie is installed by Smartlook. The cookie contains the project key, session ID, and visitor ID. Session and visitor IDs are unique identifiers assigned to new sessions and visitors.
UIDR
0
1 year
This cookie is set bu scorecardresearch.com. The cookie is used to tracks the users activity across the internet on the browser such as visit timestamp, IP address, and most recently visited webpages. and may the data send to 3rd party for analysis and reporting to help their clients better understand user preferences.
Performance cookies are used to understand and analyze the key performance indexes of the website which helps in delivering a better user experience for the visitors.
Cookie
Type
Duration
Description
__utma
0
2 years
This cookie is set by Google Analytics and is used to distinguish users and sessions. The cookie is created when the JavaScript library executes and there are no existing __utma cookies. The cookie is updated every time data is sent to Google Analytics.
__utmb
0
30 minutes
The cookie is set by Google Analytics. The cookie is used to determine new sessions/visits. The cookie is created when the JavaScript library executes and there are no existing __utma cookies. The cookie is updated every time data is sent to Google Analytics.
__utmc
0
The cookie is set by Google Analytics and is deleted when the user closes the browser. The cookie is not used by ga.js. The cookie is used to enable interoperability with urchin.js which is an older version of Google analytics and used in conjunction with the __utmb cookie to determine new sessions/visits.
__utmt
0
10 minutes
The cookie is set by Google Analytics and is used to throttle the request rate.
__utmz
0
6 months
This cookie is set by Google analytics and is used to store the traffic source or campaign through which the visitor reached your site.
_gat
0
1 minute
This cookies is installed by Google Universal Analytics to throttle the request rate to limit the colllection of data on high traffic sites.
Advertisement cookies are used to provide visitors with relevant ads and marketing campaigns. These cookies track visitors across websites and collect information to provide customized ads.
Cookie
Type
Duration
Description
__oaiq_consent
persistent
1 year
Set by the OpenAI Ads Pixel (ChatGPT Ads). Stores the visitor's measurement consent state for the pixel.
__obref
persistent
1 year
Set by the OpenAI Ads Pixel (ChatGPT Ads). Stores a random browser identifier used to measure conversions from ChatGPT ads.
__oppref
persistent
30 days
Set by the OpenAI Ads Pixel (ChatGPT Ads). Stores the ad click reference from the landing URL to attribute conversions to ChatGPT ads.
_gcl_au
persistent
3 months
Used by Google AdSense for experimenting with advertisement efficiency across websites using their services
IDE
persistent
1 year
This cookie is set by Doubleclick and carries out information about how the end user uses the website and any advertising that the end user may have seen before visiting the said website.
NID
1
6 months
This cookie is used to a profile based on user's interest and display personalized ads to the users.
test_cookie
session
11 months
The cookie is used to check if the user’s browser supports cookies.
uid
0
1 year
This cookie is used to measure the number and behavior of the visitors to the website anonymously. The data includes the number of visits, average duration of the visit on the website, pages visited, etc. for the purpose of better understanding user preferences for targeted advertisments.