

All statistics are sourced from publicly available research reports including Shopify Commerce Trends, Statista, eMarketer, Eurostat, EuroCommerce European E-commerce Report 2025, Capital One Shopping Research, Mordor Intelligence, and other cited sources. Data reflects the most recent available figures as of mid-2026.
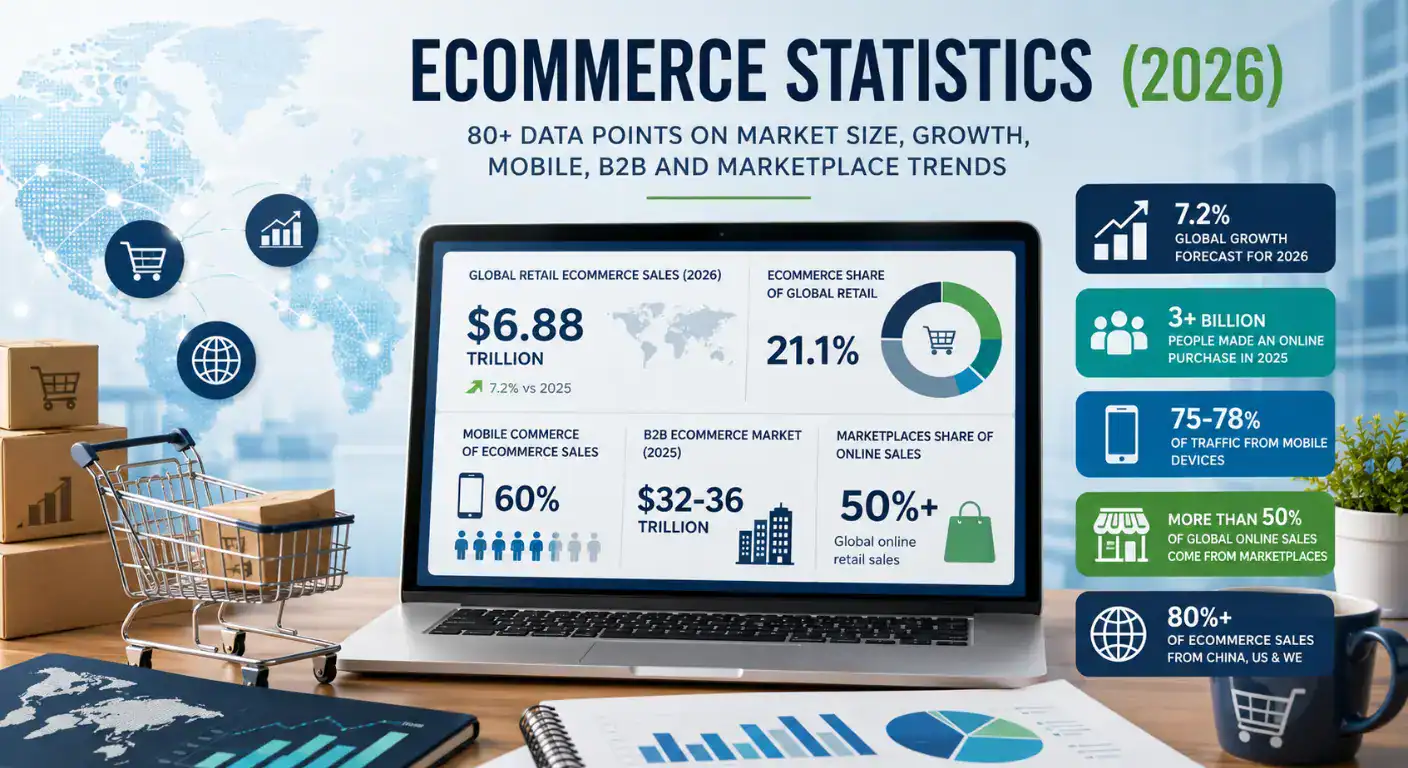
| TL;DR Global retail ecommerce sales are forecast to reach USD 6.88 trillion in 2026, representing 21.1% of total global retail. European B2C ecommerce reached EUR 842 billion in 2024, growing 7% year-on-year, with the Netherlands, Germany, and France as the largest national markets after the UK. Mobile commerce now accounts for approximately 60% of global ecommerce sales – smartphones generate 75-78% of traffic but still convert at roughly half the rate of desktop. B2B ecommerce is 5-6x larger than B2C by total transaction value, with the global B2B market estimated at USD 32-36 trillion in 2025. Marketplace platforms now account for more than half of all global online retail sales, with Amazon, Alibaba, and Pinduoduo collectively representing 45-55% of global marketplace GMV. |
The ecommerce industry generates more data than almost any other sector – and most of it is contradictory, depending on how the source defines ecommerce (B2C only vs. B2B and C2C included; products only vs. services; retail only vs. all digital commerce). Understanding what the numbers actually measure matters before you use them for planning or comparison.
This article presents 80+ ecommerce statistics for 2026, clearly attributed to their source and scope. The figures are organised by theme: global market size, regional breakdown, growth trends, cross-border commerce, mobile, B2B, marketplace data, shopping behaviour, and future trends. Each section opens with the most frequently cited headline number, followed by the supporting data that provides context.
| How to read these statistics B2C retail ecommerce: physical goods sold online to consumers. Excludes services, B2B, C2C, and digital goods. Total ecommerce (B2B + B2C + C2C): the much larger figure that includes enterprise procurement, business-to-business trade, and reseller platforms.GMV (Gross Merchandise Value): total value of goods sold through a marketplace, before deducting returns, fees, and refunds.Penetration rate: percentage of internet users, or total population, who have made at least one online purchase in the reference period. Market size figures vary by USD 2-4 trillion between research firms depending on scope definition. The differences are methodological, not errors. |
Obsah
- Global ecommerce market size (2026)
- Ecommerce growth trends (2026)
- European ecommerce market statistics (2026)
- Cross-border ecommerce statistics (2026)
- Mobile commerce statistics (2026)
- B2B ecommerce statistics (2026)
- B2C ecommerce statistics (2026)
- Marketplace ecommerce statistics (2026)
- Online shopping behaviour statistics (2026)
- Ecommerce future trends and forecasts (2026 and beyond)
Global ecommerce market size (2026)
Global retail ecommerce sales are forecast to reach USD 6.88 trillion in 2026, up from USD 6.42 trillion in 2025. This represents 21.1% of all global retail sales. Including B2B ecommerce, the combined market exceeds USD 38 trillion.
| Global ecommerce market size – key data pointsUSD 6.88 trillion – global retail ecommerce sales forecast for 2026 – Shopify / eMarketer USD 6.42 trillion – global retail ecommerce sales in 2025 (+6.8% year-on-year) – Shopify Commerce Trends 202621.1% – share of total global retail sales that are ecommerce in 2026 – eMarketer via Flowlu USD 7.89 trillion – global retail ecommerce forecast for 2028 – Shopify / eMarketer More than 3 billion – number of people who made at least one online purchase in 2025 – Shopify Commerce Trends 20262.77 billion – estimated number of active online shoppers globally in 2025 – Capital One Shopping Research USD 92 – global average order value across ecommerce categories in 2025-2026 – Ecommerce Foundation 2026 via searchlab.nl28 million+ – estimated number of active ecommerce websites globally as of 2026 – Flowlu / industry estimates |
Global ecommerce sales trajectory (2021-2028)
| Year | Global retail ecommerce (USD trillion) | YoY growth | Share of total retail |
| 2021 | 4.93 | +16.8% | 18.3% |
| 2022 | 5.29 | +7.3% | 18.8% |
| 2023 | 5.82 | +9.6% | 19.4% |
| 2024 | 6.00 | +7.7% | 20.1% |
| 2025 (est.) | 6.42 | +6.8% | 20.5% |
| 2026 (forecast) | 6.88 | +7.2% | 21.1% |
| 2028 (forecast) | 7.89 | +7.4% | 22.5% |
Sources: Shopify global ecommerce sales, eMarketer, Statista. Figures represent B2C retail ecommerce; B2B adds USD 32-36 trillion.
Ecommerce growth trends (2026)
Global ecommerce grew 7.7% in 2024 and 6.8% in 2025, with a projected rebound to 7.2% in 2026. Growth is decelerating in Western markets as penetration reaches saturation, while Southeast Asia, Latin America, and Eastern Europe are growing at 12-19% annually.
| Ecommerce growth – key data points7.2% – forecast global retail ecommerce growth rate in 2026 – Shopify / eMarketer 6.8% – actual global retail ecommerce growth in 2025 – Shopify Commerce Trends 18.6% – ecommerce growth rate in Southeast Asia in 2025 (fastest regional growth) – Mobiloud ecommerce market size by country 14.1% – projected CAGR for India’s ecommerce market 2023-2027 – Growthnavigate / Statista 10.7% – CAGR for the Netherlands ecommerce market to 2031 (fastest in Western Europe) – Mordor Intelligence Europe Ecommerce Market 2026 5.7% – CAGR for Europe ecommerce market 2020-2025 – IBISWorld Europe E-Commerce 2026 China + US + Western Europe = more than 80% of global ecommerce sales – Shopify Commerce Trends 2026 |
Fastest-growing ecommerce markets by CAGR (2024-2029)
| Market | CAGR (approx.) | Context |
| Southeast Asia | 18%+ | Mobile-first; rising middle class; super-app adoption |
| India | 14.1% | Only 5% ecommerce penetration; massive addressable market |
| Latin America | 12%+ | Brazil, Mexico, Argentina driving 84.5% of regional sales |
| Eastern Europe (CEE markets) | 10-15% | New shoppers entering the channel; logistics expanding |
| Netherlands | 10.7% | Fastest CAGR in Western Europe to 2031 |
| Western Europe (overall) | 5-7% | Mature market; growth from existing shoppers buying more |
| United States | 6.9% | Large but relatively low penetration (16% of retail) |
European ecommerce market statistics (2026)
European B2C ecommerce reached EUR 842 billion in 2024, up 7% from EUR 784 billion in 2023. The Netherlands ranks 5th in Europe and is growing at the fastest rate among major EU economies. 77.8% of EU internet users made an online purchase in 2025 (Eurostat).
| European ecommerce – key data points EUR 842 billion – European B2C ecommerce turnover in 2024 (+7% year-on-year) – EuroCommerce / Ecommerce Europe European E-commerce Report 2025 EUR 456 billion – EU-27 ecommerce market size estimate for 2026 – Statista / Mordor Intelligence EUR 1.07 trillion – projected EU-27 ecommerce market by 2031 – Mordor Intelligence Europe Ecommerce 2026 77.8% – share of EU internet users who made an online purchase in 2025 – Eurostat isoc_ec_ibuy 2025 19.5% – share of total enterprise revenue from ecommerce across EU-27 in 2025 – Eurostat 2025 via TechnologyChecker Ireland (95.3%), Netherlands (94.4%), Denmark (91.2%) – top 3 EU ecommerce penetration among internet users 2025 – Eurostat 2025 via Eightx Bulgaria (57%), Italy (61.7%), Romania (63.6%) – lowest ecommerce penetration in EU-27 – Eurostat 2025 via Eightx Netherlands ecommerce market size: USD 40.23 billion in 2026 (84%+ penetration) – Verified Market Research Netherlands 2026 |
Largest European ecommerce markets by revenue (2024-2025)
| Country | Ecommerce revenue | Year | Notes |
| France | EUR 175.3 billion | 2024 | Largest EU market; overtook Germany |
| United Kingdom | EUR 150 billion | 2024 | 3rd largest globally (goods-only methodology) |
| Spain | EUR 95.2 billion | 2024 | Edged Germany for 2nd place in EU for first time |
| Germany | EUR 94.0 billion | 2024 | Ecommerce is 19% of total enterprise revenue |
| Netherlands | USD 40.23 billion (~EUR 37 billion) | 2026 forecast | 5th in Europe; fastest CAGR 10.7% to 2031 |
| Poland | EUR 35.2 billion | 2024 | Largest CEE market; growing at 12%+ per year |
| Belgium | EUR 30 billion (est.) | 2024 | 30% of enterprise revenue from ecommerce |
| Sweden | EUR 18-20 billion (est.) | 2024 | High penetration; strong Klarna BNPL adoption |
| Ireland | EUR 16 billion (est.) | 2025 | Highest enterprise ecommerce revenue share in EU (33%) |
Sources: EuroCommerce European E-commerce Report 2025, Cross-Border Magazine European ecommerce snapshot 2026, Mordor Intelligence. Methodologies vary by country.

Cross-border ecommerce statistics (2026)
Cross-border ecommerce reached USD 1.21 trillion in 2025, growing 6.5% year-on-year. Within Europe, in the Netherlands 68% of online shoppers buy from international retailers.
| Cross-border ecommerce – key data pointsUSD 1.21 trillion – global cross-border ecommerce market in 2025 (+6.5% year-on-year) – Capital One Shopping Research EUR 237 billion – European cross-border ecommerce market in 2023 (latest comparable data) – AWISEE / Ecommercenews 68% – share of Dutch online shoppers buying from international retailers in 2026 – Verified Market Research Netherlands Ecommerce Market 2026 80.5% – share of global ecommerce accounted for by China, US, and Western Europe combined – Shopify Commerce Trends 2026 Eastern Europe B2C ecommerce grew 18% nominal in 2024, driven by new shoppers entering the channel – Eightx analysis of Eurostat data |
Cross-border selling within the EU benefits from the Single Market framework, which eliminates customs duties between member states for qualifying goods. The EU VAT One-Stop-Shop (OSS) scheme allows merchants to file a single return covering all EU B2C sales above EUR 10,000 annually, reducing the administrative complexity of cross-border expansion.
Mobile commerce statistics (2026)
Mobile commerce accounts for approximately 60% of global ecommerce sales in 2026, up from 59% in 2025. Mobile devices generate 75-78% of all ecommerce site traffic, but convert at half the rate of desktop.
| Mobile commerce – key data points~60% – mobile commerce share of global ecommerce sales in 2026 (up from 43% in 2018) – Statista via Firework analysis USD 2.51 trillion – global mobile commerce sales in 2025 (+21.3% year-on-year) – Capital One Shopping Research USD 4.01 trillion – projected global mobile commerce sales in 2026 – eMarketer via Flowlu 75-78% – share of all ecommerce site traffic generated by mobile devices – Statista / SimilarWeb via Capital One~2% average mobile conversion rate vs. ~3% on desktop – Kibo Commerce via Mobiloud 1.65 billion – number of people expected to shop via smartphone in 2026 – Statista via Demandsage 70% of US mobile shoppers prefer dedicated apps over mobile websites for purchases – Fortune Business Insights via Demandsage USD 155 average desktop order value vs. USD 112 on mobile – Kibo Commerce benchmarks via Mobiloud 80% – mobile cart abandonment rate vs. 66% on desktop – Baymard Institute South Korea leads with 77% of ecommerce sales on mobile – the highest rate globally – Statista 2026 via Demandsage |
Mobile vs desktop: the gap between traffic and revenue
| Metric | Mobile | Desktop |
| Share of ecommerce site traffic | 75-78% | ~22-25% |
| Share of global ecommerce revenue | ~60% | ~40% |
| Average conversion rate | ~2% | ~3% |
| Average order value | USD 112 | USD 155 |
| Cart abandonment rate | ~80% | ~66% |
| App vs web preference (US) | 70% prefer apps | N/A |
Sources: Kibo Commerce, Baymard Institute, Statista / Capital One Shopping Research, SimilarWeb.
B2B ecommerce statistics (2026)
The global B2B ecommerce market is estimated at USD 32-36 trillion in 2025 – five to six times larger than B2C retail ecommerce by transaction value. In Europe, B2B transactions are forecast to exceed USD 1.93 trillion by 2026, growing at 9.7% per year.
| B2B ecommerce – key data points USD 32.1 trillion – estimated global B2B ecommerce GMV in 2025 – Capital One Shopping Research USD 36 trillion – projected global B2B ecommerce market by 2026 (some estimates) – Craftberry / IMARC analysis USD 1.93 trillion – European B2B ecommerce forecast for 2026 (growing at 9.7% CAGR) – Mordor Intelligence Europe Ecommerce Market 2026 65% – share of B2B sellers who have enabled online ordering in response to buyer expectations – Mordor Intelligence 2026 61% of B2B buyers now choose a buying journey with no sales representative involved – Craftberry global ecommerce statistics 2025/2026 73% of B2B buyers are Gen Z or Millennials, preferring digital-first purchasing experiences – Craftberry / McKinsey 75% of B2B buyers say they would switch supplier for a more seamless online buying experience – McKinsey B2B Commerce Survey USD 83.1 billion – Amazon Business GMV in 2025 (6.2% of Amazon total GMV) – Capital One Shopping Research |
B2C ecommerce statistics (2026)
The global B2C ecommerce market reached USD 5.2 trillion in 2024 and is projected to grow to USD 9.8 trillion by 2033. Fashion is the largest B2C product category globally at USD 1.25 trillion in 2024. Average global ecommerce conversion rate sits at approximately 1.6%.
| B2C ecommerce – key data points USD 5.2 trillion – global B2C ecommerce market in 2024 – Shopify Enterprise Blog 2026 USD 9.8 trillion – projected global B2C market by 2033 (6.63% CAGR) – Shopify Enterprise Blog 2026 1.6% – global average ecommerce conversion rate (varies 0.5-5% by category) – IRP Commerce / Growthnavigate 2026 USD 1.25 trillion – global online fashion sales in 2024 (largest B2C product category) – ECDB Global Ecommerce Report 2025 USD 45 average order value for fashion; USD 260 for consumer electronics – Ecommerce Foundation 2026 via searchlab.nl 51% of US consumers always research online before a major in-store purchase – Capital One Shopping Research 42% of Millennials and 41% of Gen Z planned to spend more online in 2025 – Capital One Shopping Research |
Top ecommerce product categories globally by revenue
| Category | Revenue (2024) | Key drivers |
| Fashion & apparel | USD 1.25 trillion | Fast-fashion cycles, mobile-first, social commerce, DTC brands |
| Consumer electronics | USD 0.9-1.0 trillion | High AOV, frequent upgrades, comparison shopping online |
| Home & garden | USD 0.6-0.8 trillion | Urbanisation, smart home adoption, marketplace growth |
| Food & grocery | USD 0.5-0.7 trillion | 14% growth in Europe 2025; subscription models growing |
| Beauty & personal care | USD 0.3-0.4 trillion | Social commerce, influencer-driven, high repeat purchase |
| Toys & games | USD 0.2-0.3 trillion | Seasonal peaks (Q4), marketplace-dominant |
Sources: ECDB Global Ecommerce Report 2025, Shopify Commerce Trends, IMARC Group.

Marketplace ecommerce statistics (2026)
Online marketplaces account for more than 50% of global ecommerce sales. The top five platforms – Amazon, Alibaba, Pinduoduo, JD.com, and Walmart – collectively capture 60-65% of all marketplace-driven retail globally.
| Global marketplace – key data points 50%+ – share of global online retail sales that take place on marketplace platforms – IMARC / industry consensus via Flowlu 45-55% – estimated share of global marketplace GMV held by Amazon, Alibaba, and Pinduoduo combined – IMARC Group 2026 via Flowlu USD 847.4 billion – Amazon.com total ecommerce GMV in 2025 (+7.25% year-on-year) – Capital One Shopping Research USD 780.5 billion – Pinduoduo GMV in 2025 (largest single platform by GMV globally) – Capital One Shopping Research 2.51 billion – monthly visits to Amazon.com in April 2026 – Capital One Shopping Research 50% of European consumer electronics sales online expected through third-party marketplaces by 2025, up from 40% in 2024 – Mordor Intelligence Europe Ecommerce 2026 Amazon: 37.6% of all US online retail sales in 2024 – Capital One Shopping Research |
Key European marketplace benchmarks
| Marketplace | Key metric | Context |
| Amazon.de | 35%+ German ecommerce market share | Largest single marketplace in Germany; European seller account covers 8 EU markets |
| bol.com | 13 million+ active customers (NL + BE) | bol.com Silver Partner programme for verified integrators; dominant NL/BE marketplace |
| Zalando | 50 million+ active customers, 25 countries | Fashion and lifestyle; EUR 14 billion+ GMV; curated brand entry model |
| Allegro | 21 million+ registered buyers | 35%+ of Polish ecommerce market; EUR 3 billion+ in sales |
| Kaufland | 35 million+ monthly visitors, 6 countries | Covers DE, AT, CZ, SK, PL, RO; growing fast in Central/Eastern Europe |
Sources: Platform-reported figures, EuroCommerce, Mordor Intelligence, Capital One Shopping Research. Active customer and visitor figures are latest available as of mid-2026.
Online shopping behaviour statistics (2026)
The average global ecommerce conversion rate is 1.6%. Cart abandonment averages 70% globally. Digital wallets are now the most common payment method in ecommerce, used in 56% of global online transactions in 2025. Social commerce reached USD 821 billion in 2025.
| Shopping behaviour – key data points 1.6% – global average ecommerce conversion rate (range: 0.5-5% by device, category, and traffic source) – IRP Commerce / Growthnavigate 70% – global average shopping cart abandonment rate – Baymard Institute 56% – share of global online purchases using digital wallets in 2025 – Capital One Shopping Research 49% – share of all global ecommerce sales funded through digital wallets in 2026 – Statista via Firework analysis 70% iDEAL – share of Dutch domestic online transactions in 2026 (transitioning to Wero) – Verified Market Research Netherlands Ecommerce 2026 USD 821 billion – global social commerce market in 2025 (+19.9% year-on-year) – Capital One Shopping Research / eMarketer 90%+ of social commerce transactions happen on smartphones – Firework mobile commerce analysis 2026 BNPL used in 4% of global ecommerce transactions; 21% in Germany and Sweden specifically – Capital One Shopping / ECDB 62% of mobile commerce transactions are impulse purchases – Fortune Business Insights via Demandsage |
Payment method preferences by European market
| Country | Dominant payment method | Secondary / growing methods |
| Netherlands | iDEAL (70%+ of online transactions; migrating to Wero) | Credit card, BNPL (11% usage), PayPal |
| Germany | Credit card, SEPA bank transfer | BNPL (21% usage, especially Klarna), PayPal |
| Belgium | Bancontact, credit card | PayPal, BNPL (growing) |
| Sweden | Credit card, Swish | BNPL (21%; Klarna originated here), bank transfer |
| Denmark | MobilePay, credit card | BNPL (12%), bank transfer |
| Spain | Credit card; 1 in 3 prefer instalments | BNPL growing rapidly; local card networks |
| Turkey | Credit card (48%) | Highest credit card usage in Europe; cash on delivery 5% |
Sources: ECDB European Ecommerce 2025, Verified Market Research Netherlands 2026, TechnologyChecker.io Europe statistics. Payment landscape evolves rapidly; verify current preferences before market entry.
Ecommerce future trends and forecasts (2026 and beyond)
The major trends shaping ecommerce through 2030 are AI-driven personalisation, continued mobile dominance, social commerce growth, B2B ecommerce acceleration, and the structural expansion of marketplaces. By 2028, ecommerce is expected to account for 22.5% of global retail sales.
| Key ecommerce forecasts for 2027-2033 USD 7.89 trillion – global retail ecommerce forecast for 2028 – eMarketer via Shopify 22.5% – projected share of total global retail that will be ecommerce by 2028 – eMarketer via Shopify USD 3.35 trillion – projected global mobile commerce sales by 2028 (CAGR 12.76%) – Demandsage / Statista 63% – projected mobile commerce share of total ecommerce by 2028 (up from 60% in 2026) – Statista forecast via Firework USD 62.2 trillion – projected global B2B ecommerce spending by 2030 – Capital One Shopping Research 70% – share of ecommerce companies expected to use AI for personalisation or demand forecasting by 2026 – Tekrevol analysis 2026 EUR 1.07 trillion – projected EU-27 ecommerce market size by 2031 – Mordor Intelligence Europe Ecommerce 2026 EUR 1.4 trillion – European ecommerce sales projection for 2027 – EuroCommerce / AWISEE USD 10 trillion+ – global retail ecommerce projected by 2033 – Statista long-range forecast via Capital One |
Five structural trends defining ecommerce through 2030
| Trend | Scale / timeline | What it means for merchants |
| AI-powered personalisation | 70% of ecommerce companies using AI by 2026 | Product recommendations, dynamic pricing, demand forecasting become standard |
| Mobile-first commerce | 63% of ecommerce on mobile by 2028 | App-quality mobile experiences become table stakes; desktop remains important for B2B and high-AOV categories |
| Social commerce expansion | USD 1 trillion+ projected by 2028 | TikTok Shop, Instagram, and YouTube Shopping require separate channel strategies |
| B2B ecommerce acceleration | USD 62 trillion by 2030 | B2B buyers expect B2C-quality purchasing experiences; 65% of B2B sellers investing in online ordering now |
| Marketplace dominance | 50%+ of online sales through marketplaces now | Multichannel presence on 3-5 marketplaces alongside a direct store is the baseline for most product categories |
| Selling across European marketplaces and advertising channels? Koongo connects your Shopify, WooCommerce, or Magento store to 500+ channels across Europe and beyond including bol.com, Amazon, Zalando, Kaufland, Google Shopping, Meta Ads, and 490+ more. Feed management and marketplace API integration in one platform. Permanent Free Plan. Paid plans from EUR 12/month. 7-day free trial, no credit card required. |